Meditating with microprocessors
- Artificial Intelligence based Hardware(Microprocessor) tuning: Implementing a very simple idea (part-1)
- A crashcourse in Microarchitecture and Linux CPUIDLE interface (part-2)
- Trading off power for UltraLowLatency (part-3)
- Artificial Intelligence guided Predictive MicroProcessor tuning (part-4)
- Introduction
- Is there a solution?
- Is there a smarter solution?: Artificial Intelligence model based proactive decision making
- Recognizing the pattern
- Transformer as the backbone
- Transfer Learning inspiration from NLP
- Fine tuning pre-trained networks
- Artificial Intelligence model based proactive and predictive decision making
- The Final Cut
- Summary
- Appendix:Tools of the trade (part-5)
Introduction
The current article is part of a bigger series titled Meditating-with-microprocessors, in which I demonstrate the use of Artificial Intelligence to tune microprocessors for Ultra Low Latency and Realtime loads. There are 5 parts to the series, Meditating with Microprocessors: An essentially simple idea(part-1) , A crashcourse in Microarchitecture and Linux CPUIDLE interface(part-2), Core (part-3) , Uncore (part-4), Appendix:Tools (part-5). In the current article, we drill down into the inner workings of Ftrace and EBPF. With EBPF based techniques and frameworks Linux tooling has gained tracing superpowers. It has capabilities that now exceed that of Dtrace on Solaris. This is not an exhaustive section and it does not do a breadth-first scan of Linux tooling. I am highlighting a couple of tools, why they work for us, and what makes them special. Moreover, tools play a vital role in verifying or rebutting the theories we make about the systems we design. Building/designing a system is like building a beehive, little blocks you put together making it a whole. But these little blocks fit more snuggly if the theory is rock-solid. Tools provide us the evidence for that.
Linux Tools:An incisive but limited view
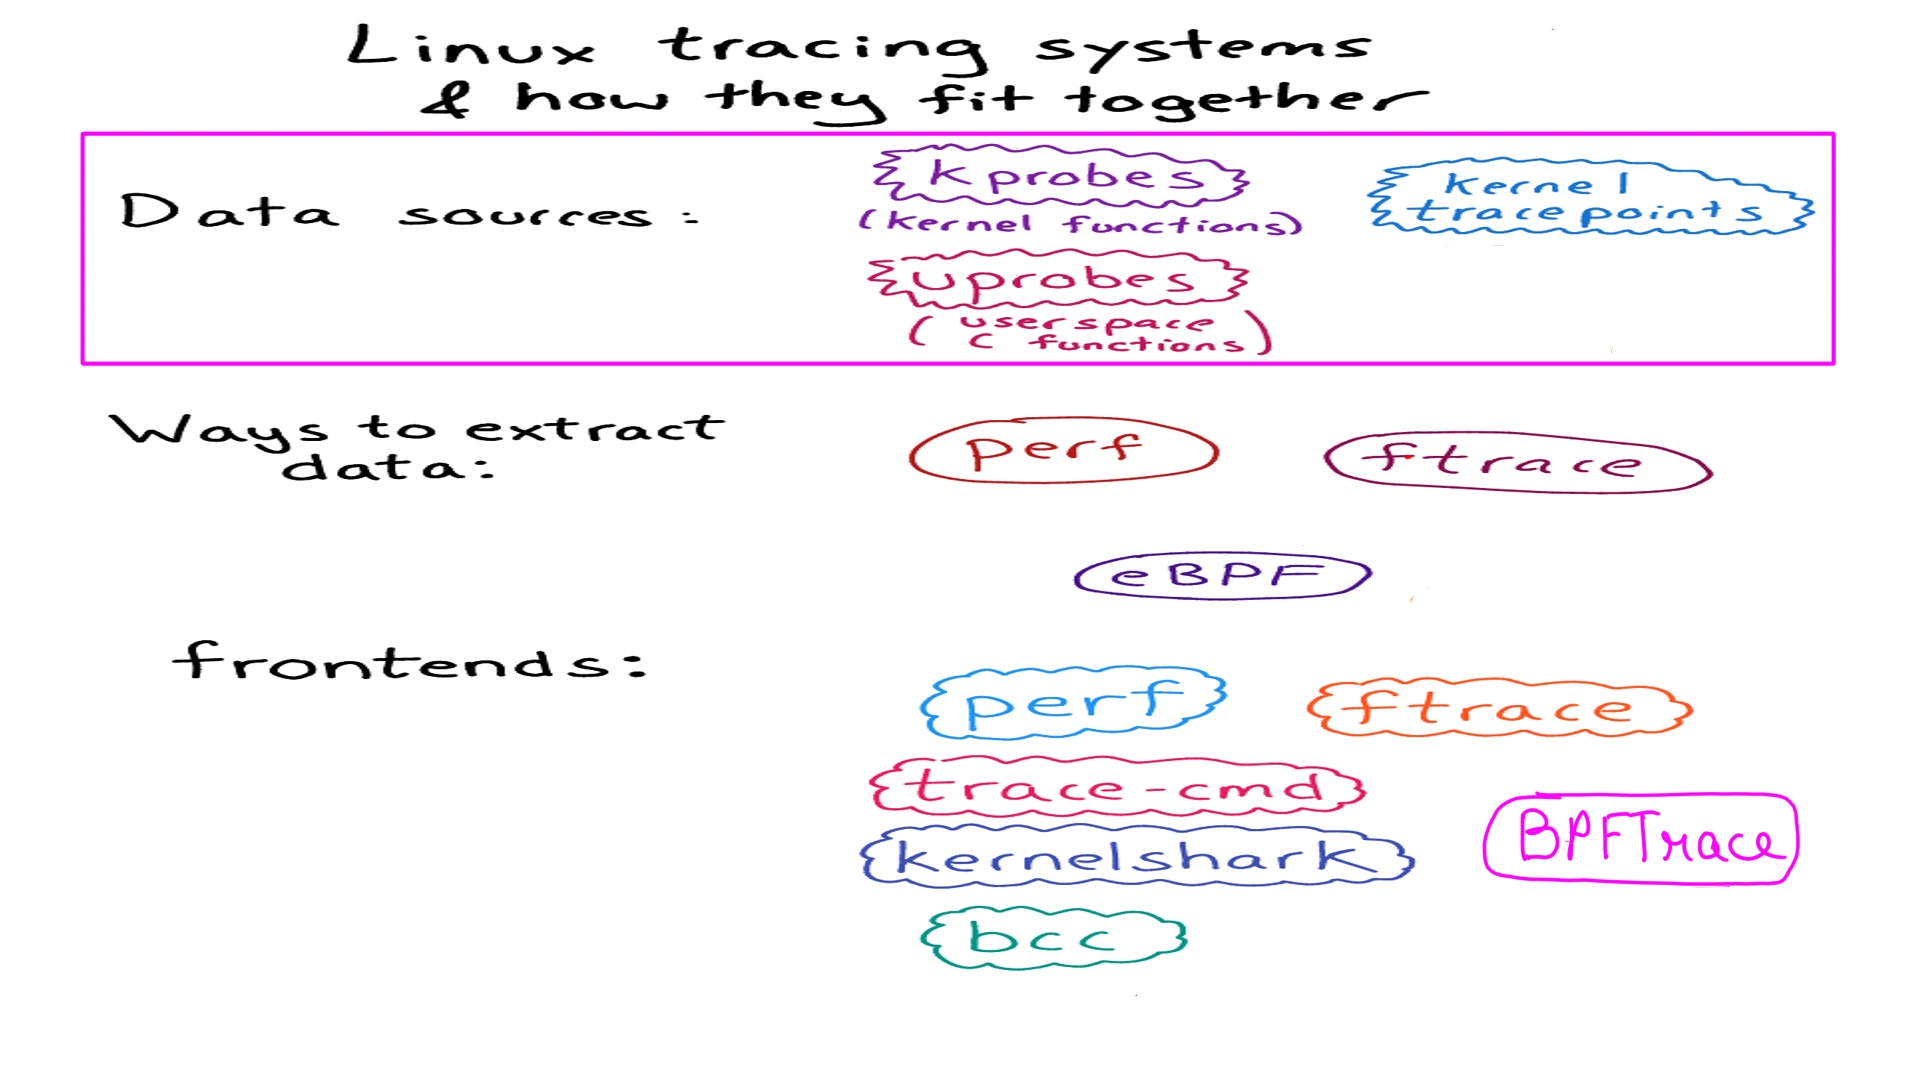
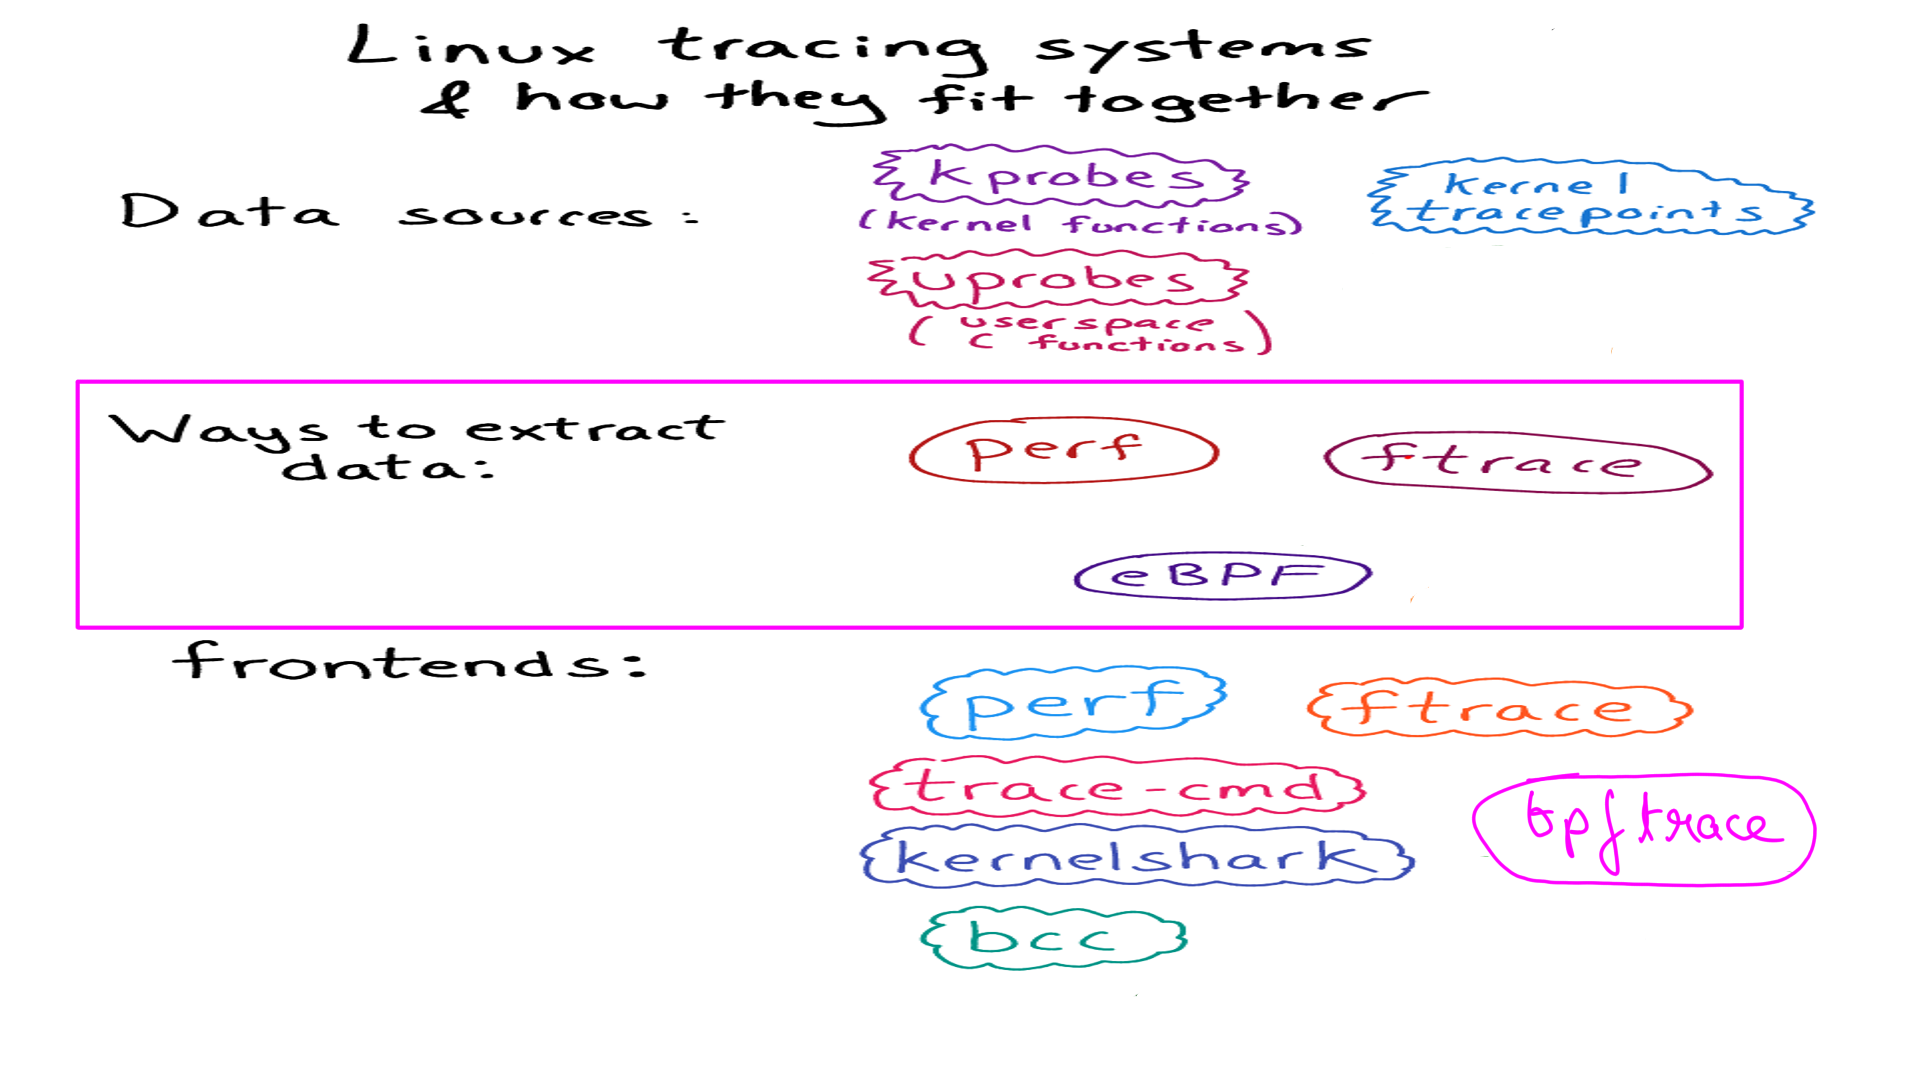
There is a great article that takes an expansive look at linux tooling and declutters the theory behind it. Here we look at the details of how a couple of them work and what makes them special.
- The original picture can be found here. I have modified it to bit highlight our focus in this article.
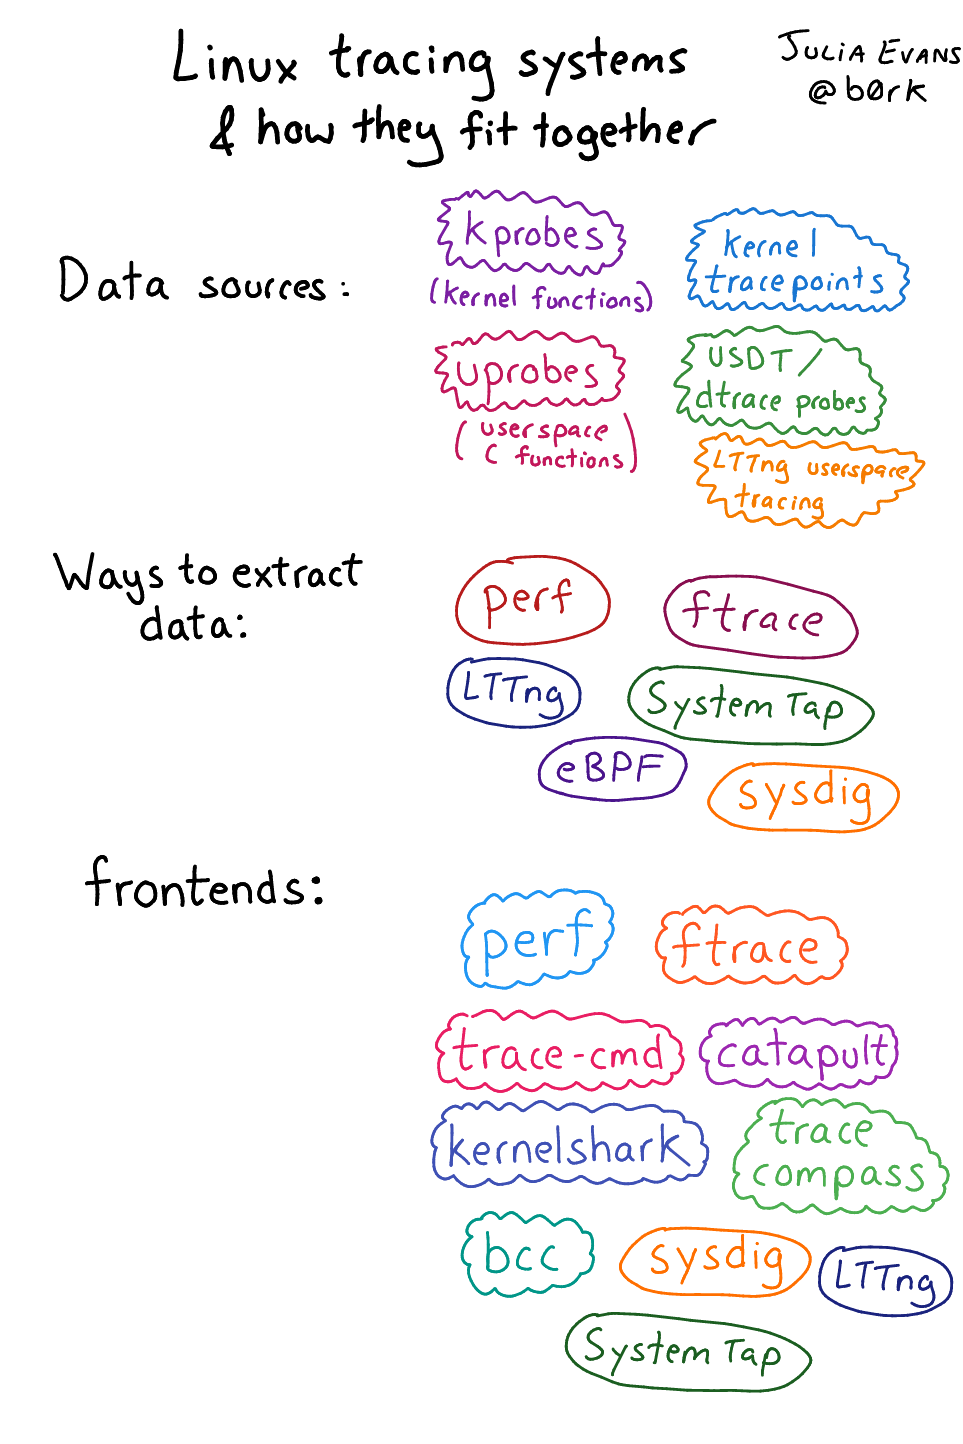
Linux Tools:Event Sources:uprobes and kprobes
The technique of dynamic instrumentation is quite old(1990s if my memory serves me right) and reasonably mature. However, its application to Linux is relatively recent(mid 2000). Similar to techniques used in debuggers. They are called uprobes , uretprobes, kprobes and kretprobes in Linux. uprobes and uretprobes are for user-space processes. uprobes are function entries and uretprobes are function exits. kprobes and kretprobes are for kernel space. The technique of application is nearly identical.
- When a CPU hits the breakpoint instruction, a trap occurs, the CPU’s registers are saved, and control passes to kprobes/uprobe via the notifier_call_chain mechanism.
- The original instructions are then executed, and instruction flow resumes.
- When the kprobe/uprobe is no longer needed, the original bytes are copied back to the target address, restoring the instructions to their original state.
- Since kprobes can probe into a running kernel code, it can change the register set, including instruction pointer. This operation requires maximum care, such as keeping the stack frame, recovering the execution path etc. Since it operates on a running kernel and needs deep knowledge of computer architecture and concurrent computing, you can easily shoot your foot.
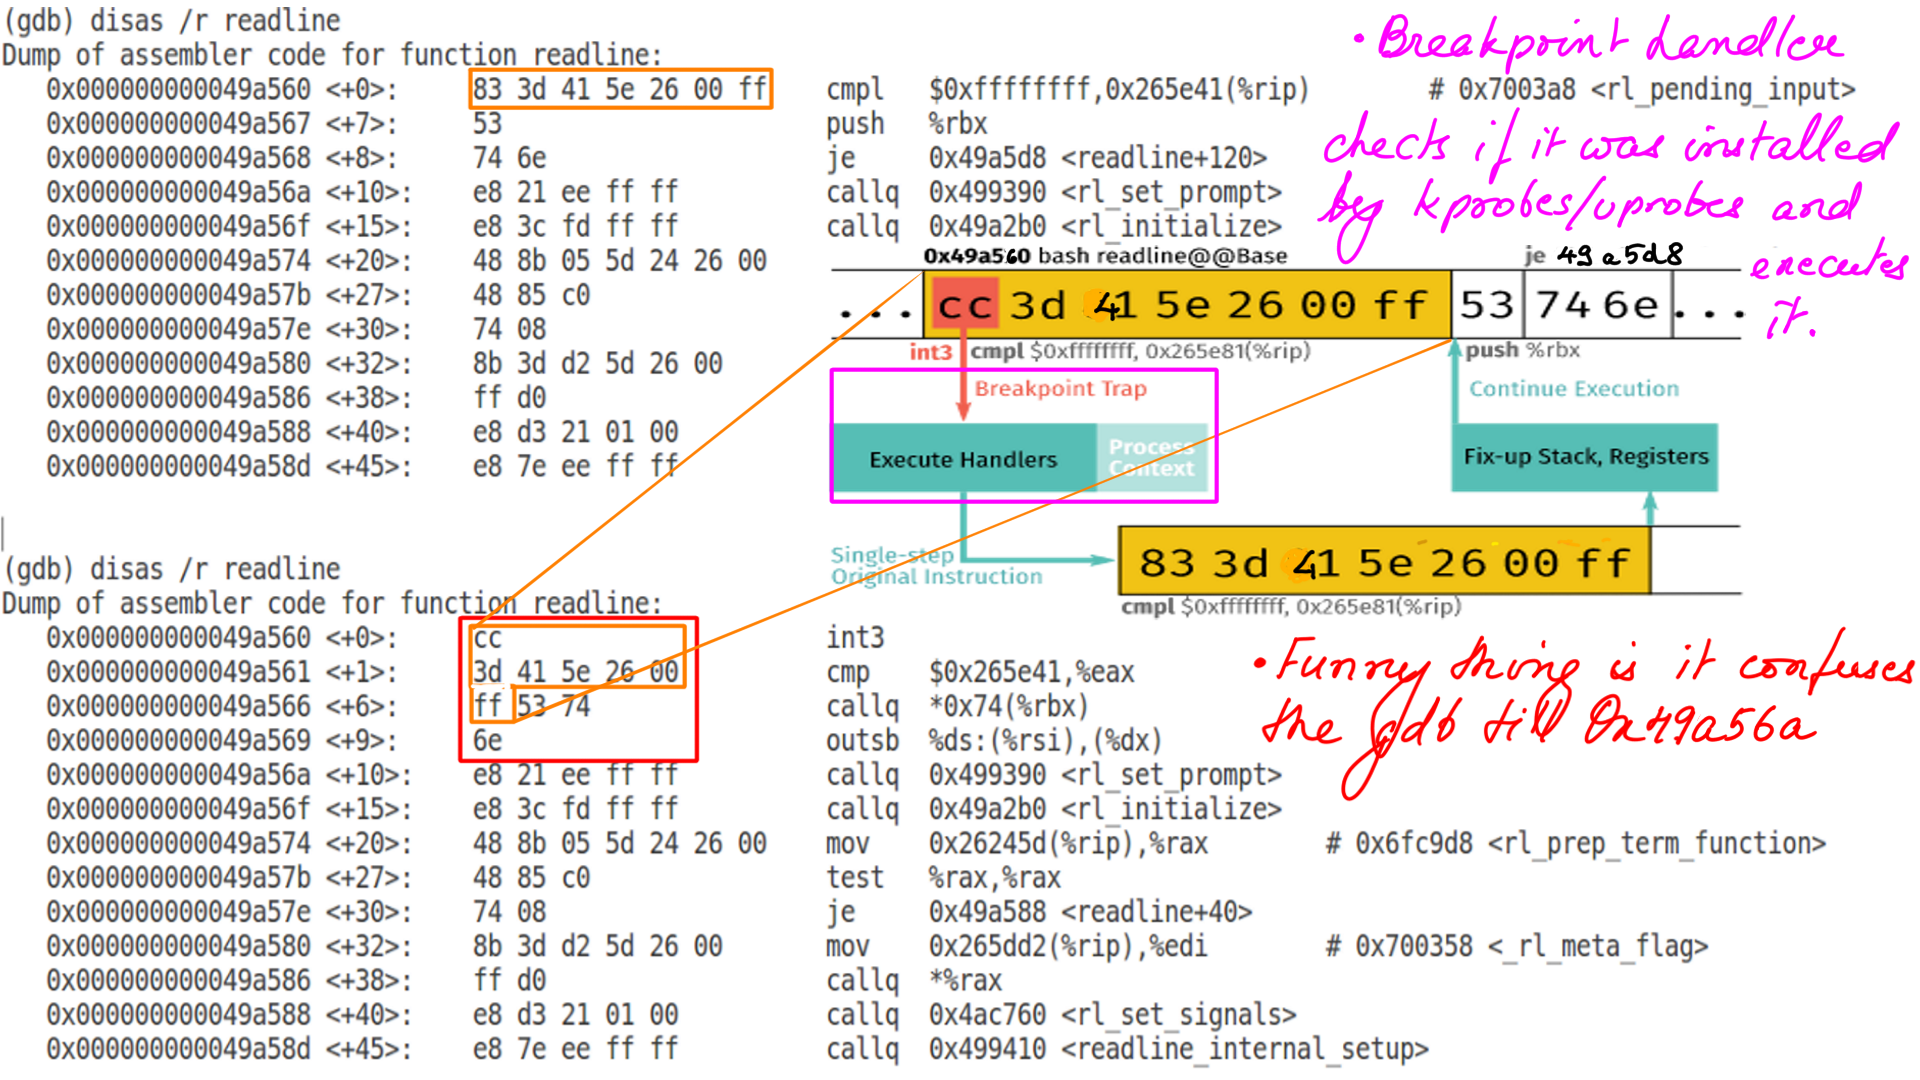
- Instrumenting bash’s readline with bpftrace.
sudo gdb -p <bashpid>
file /usr/lib/debug/bin/bash
disas /r readline

sudo bpftrace -e 'uprobe:/bin/bash:readline { @ = count() }'

sudo gdb -p <bashpid>
file /usr/lib/debug/bin/bash
disas /r readline
- The figure below shows before and after instrumentation.
- Notice the insertion of int3 breakpoint instruction.
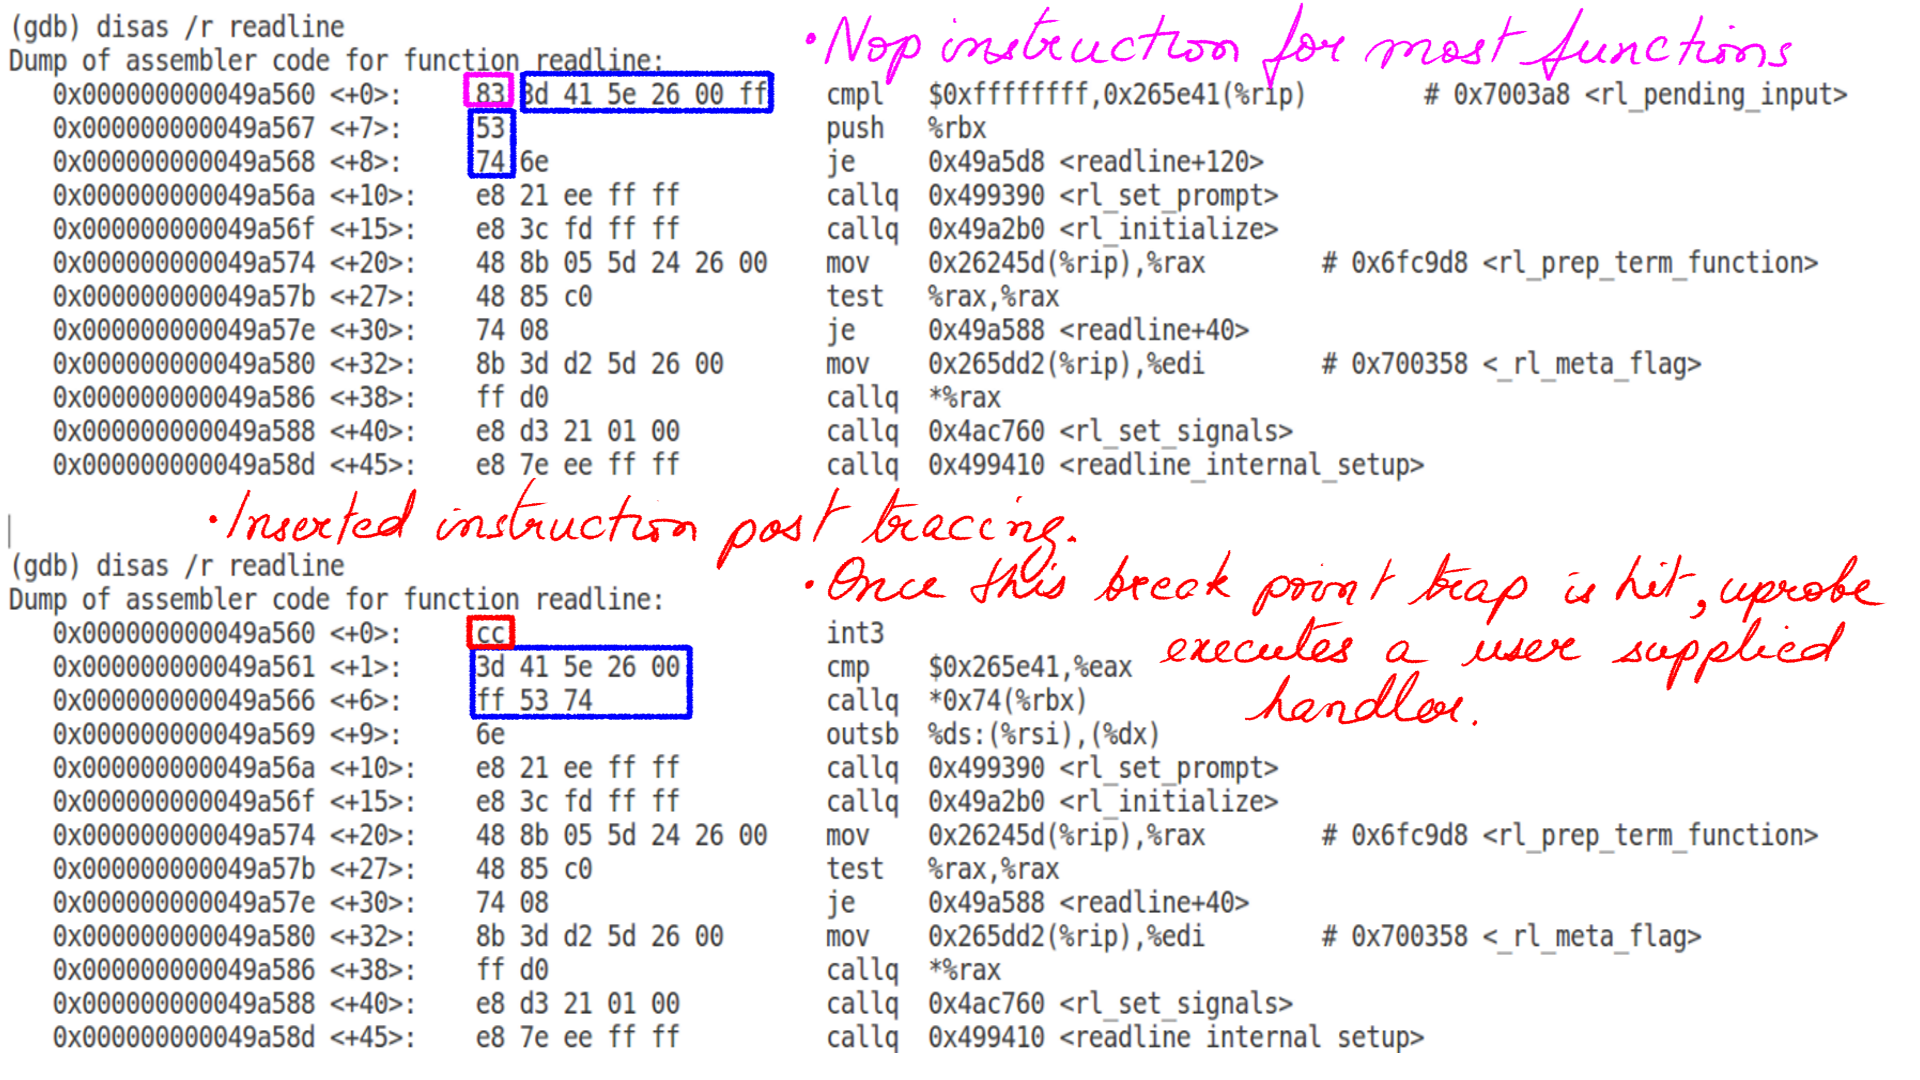
- When instruction flow hits this breakpoint, the breakpoint handler checks if it was installed by kprobes, and, if so, executes a kprobe handler.
Linux Tools:Event Sources:Tracepoints
Tracepoints are used for kernel static instrumentation. They involve tracing calls that developers have inserted into the kernel code at logical places, which are then compiled into the kernel binary. Tracepoints are a burden for kernel developers to maintain, and tracepoints are far more limited in scope than kprobes. The advantage is that tracepoints provide a stable API: Tools written to use tracepoints should continue working across newer kernel versions, whereas those written using kprobes may break if the traced function is renamed or changed.
- Try using tracepoints first, if available and sufficient, and turn to kprobes only as a backup.
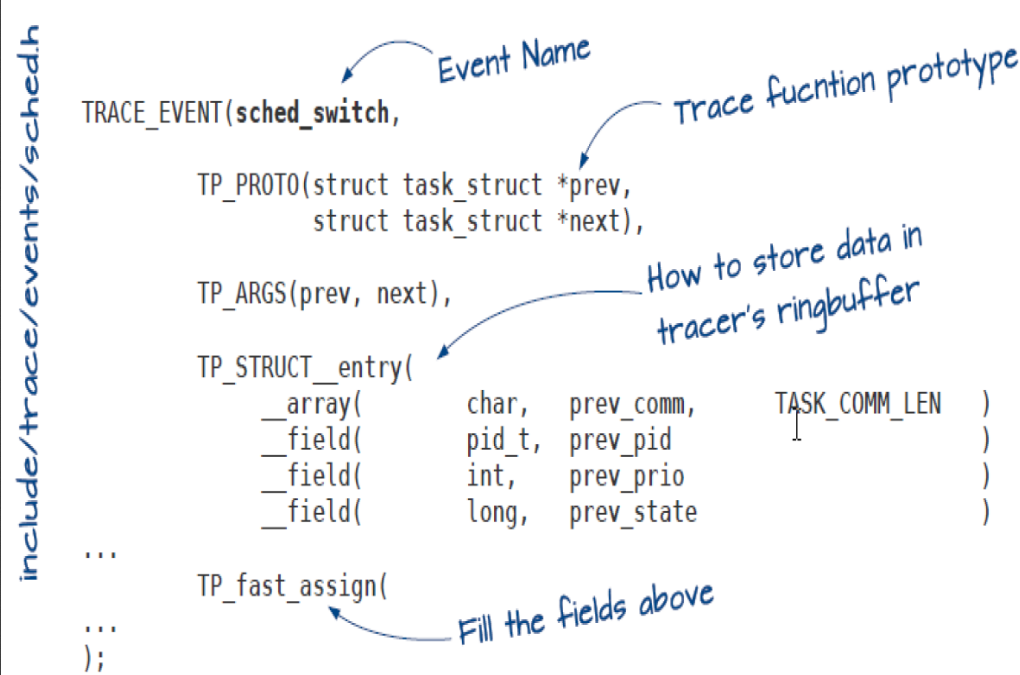
- A tracepoint is inserted using the TRACE_EVENT macro.
- It inserts a callback in the kernel source that gets called with the tracepoint parameters as arguments.
- Tracepoints added with the TRACE_EVENT macro allow ftrace or any other tracer to use them.
- The callback inserts the trace at the calling tracer’s ring buffer.–To insert a new tracepoint into the Linux kernel, define a new header file with a special format.
- By default, tracepoint kernel files are located in include/trace/events(scheduling related tracepoints are declared in (“include/trace/events/sched.h”)). If they are not located in this directory, then other configurations are necessary.
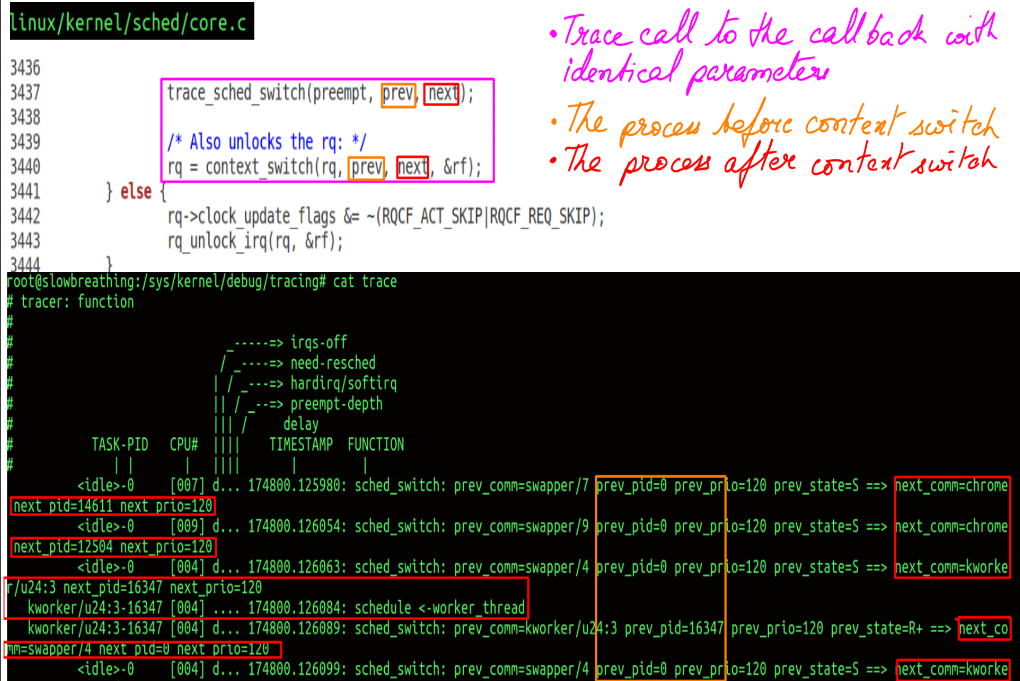
- Scheduling trace captured using tracepoint.
- This particular tracepoint is sched_switch.
- trace_sched_switch is statically placed in the code by the TRACE_EVENT macro.
Linux Tools:Extraction Tools
We will look at 2 of these tools. One of them quite old and other one relatively new.
Linux Tools:Extraction Tools:Ftrace:The coolest tracing dude on the planet
Ftrace as the coolest tracing dude on the planet. What makes ftrace such a fire-cracker.
- It is a part of Linux kernel since 2.6.28 (which in ancient times) and is the official Linux tracer.
- It means there is no installation or compatibility overhead at all.
- People in the embedded domain (Raspberry Pi) or even distributions like Busybox adore ftrace as it’s foot print is negligible and absolutely NIL installation requirements.
Linux Tools:Extraction Tools:Ftrace:Engineering
How is it possible to instrument all(most) kernel functions with almost nil overhead. The way this is done, in my mind, is one of the best pieces of engineering that I have seen. Here is the original video by Steven Rostedt that describes ftrace engineering in all it’s gory details. Below is much simplified version of the same.
- When the Linux kernel is compiled with “-pg -mfentry” option, the GCC compiler adds special “__fentry__” call to all non-inlined functions.
- All non inlined functions call “__fentry__” function at the beginning of the function.
- The figure below shows “schedule” when compiled with the above option.
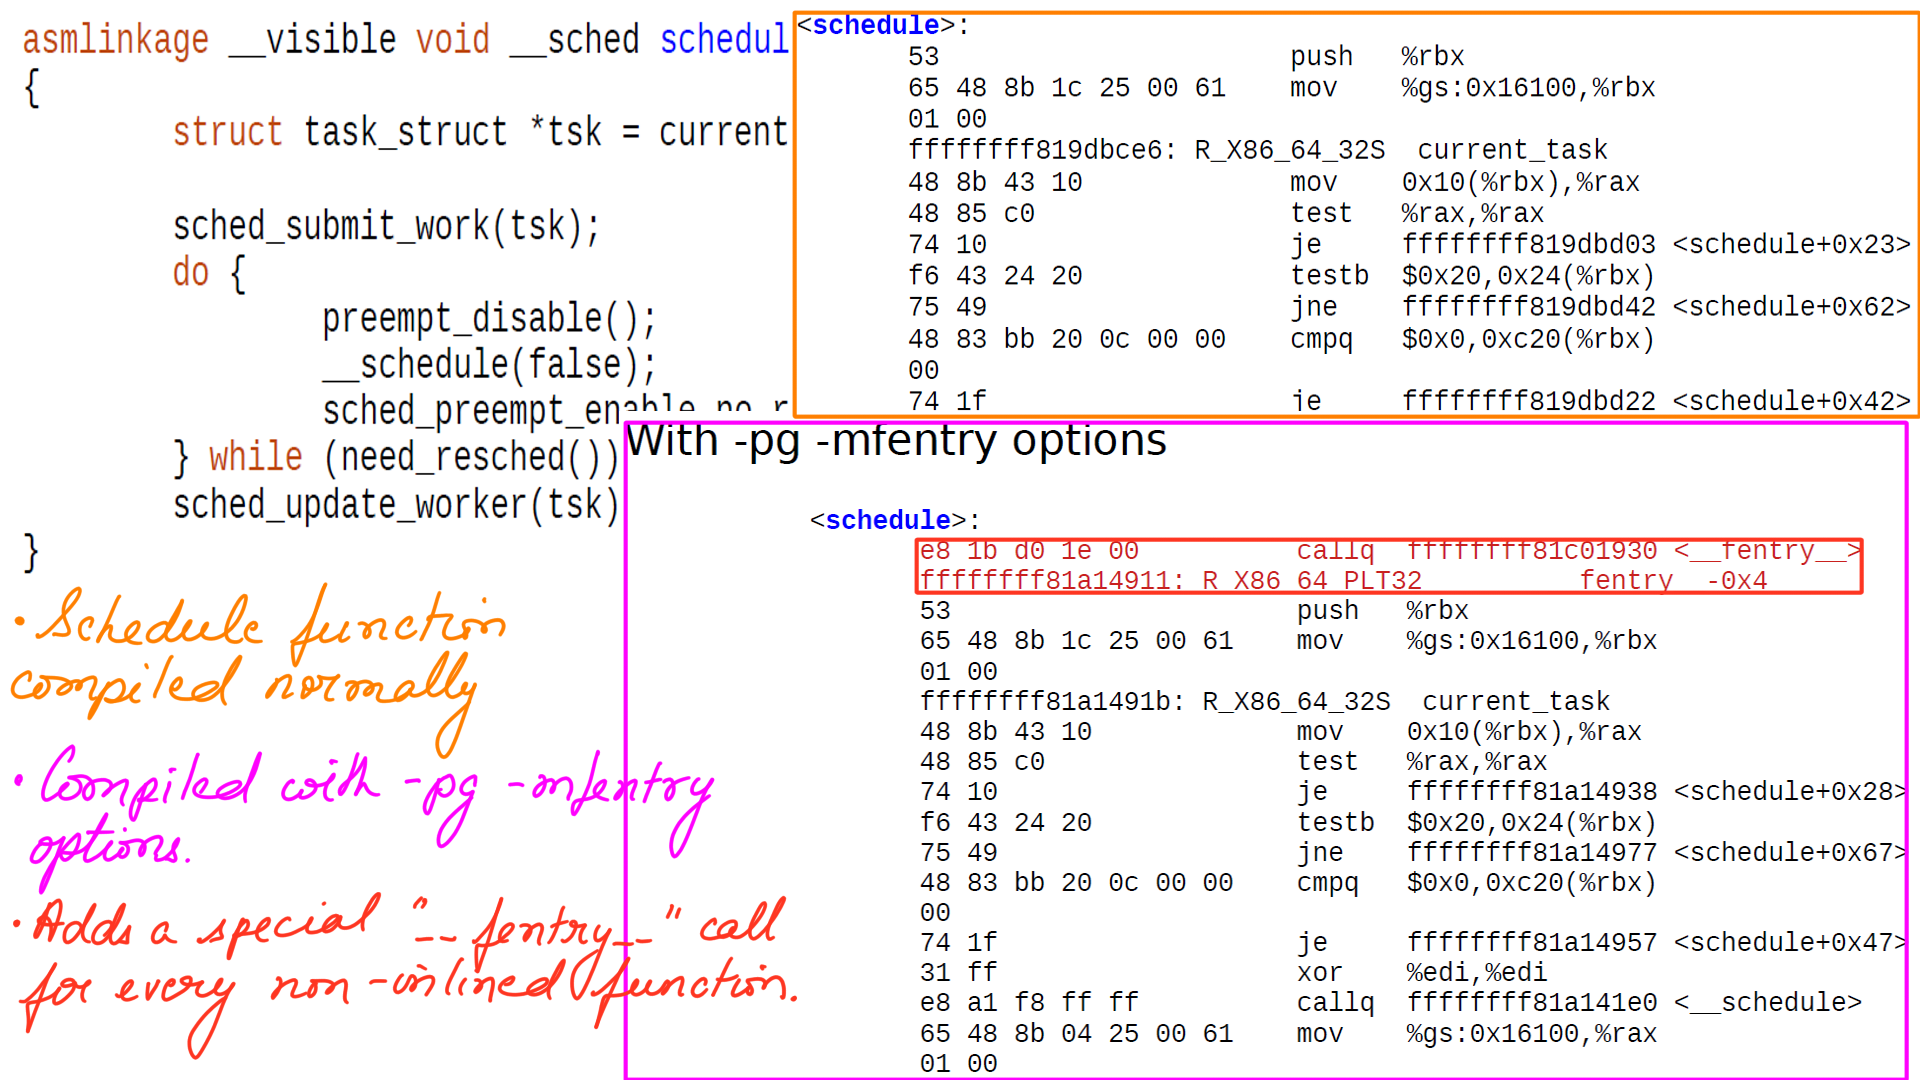
- Recall, that the broad goal here is the trace kernel functions with minimal overhead when turned off. “__fentry__” is placed for exactly the same reason.
- But calling “__fentry__” function from every non inlined function is going to be huge overhead even if the function does not do anything.
- The cost of calling and returning from nearly 40 thousand kernel function is nearly 13-15% and clearly not acceptable.
- “recordmcount.c” reads the object file one at a time and finds the “__fentry__” call location(call-site address) and creates an array called “mcount_loc.”
- “__start_mcount_loc” and “__stop_mcount_loc” are variables that define the start and stop of a section in vmlinux object file. These are inserted into the vmlinux file by the linker and have all the call-site addresses.
- At boot time we find the addresses of the functions in the array between “__start_mcount_loc” and “__stop_mcount_loc” and convert them to NOPs(figure-8).
- GCC-5 adds -mnop-mcount for the same purpose.
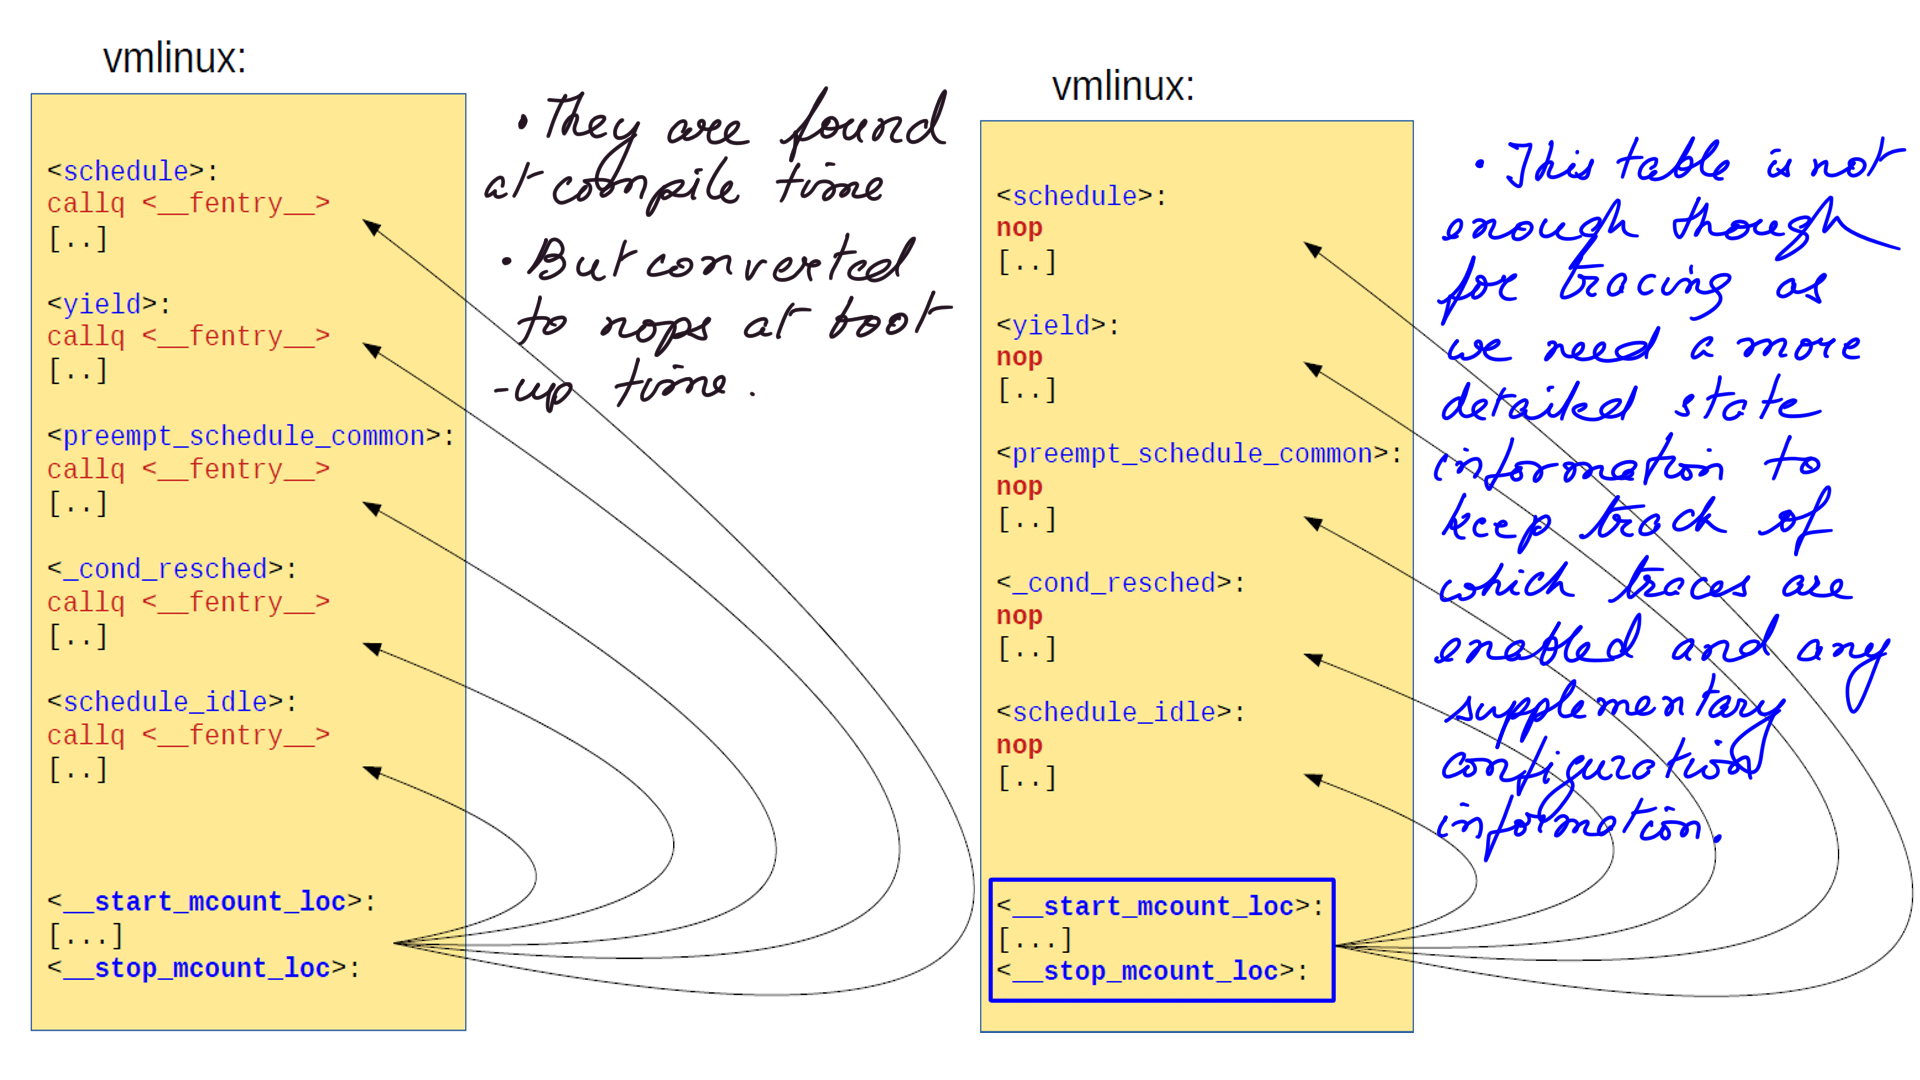
- However, The array between “__start_mcount_loc” and “__stop_mcount_loc” is not enough for ftrace framework to work.
- We need state information along with the function addresses to be stored per each kernel function to track the functions to be dynamically traced.
- This state information is stored in pages using struct “ftrace_page”.
- Each “ftrace_page” has multiple “dyn_ftrace” as an array of structs. “ip” stores the class-site addresses and the flags stores the state of that particular call-site.
  struct ftrace_page {
  	struct ftrace_page *next;
  	struct dyn_ftrace	*records;
  	int			index;
  	int			size;
  }

  struct dyn_ftrace {
  	unsigned long		ip; /* address of mcount call-site */
  	unsigned long		flags;
  	struct dyn_arch_ftrace	arch;
  };
- Figure-9 below depicts “ftrace_page” and array of struct “dyn_ftrace”.
- The memory consumed by “ftrace_pages” is roughly 630 kilobytes in approximately 154 pages for close to 40 thousand kernel functions.
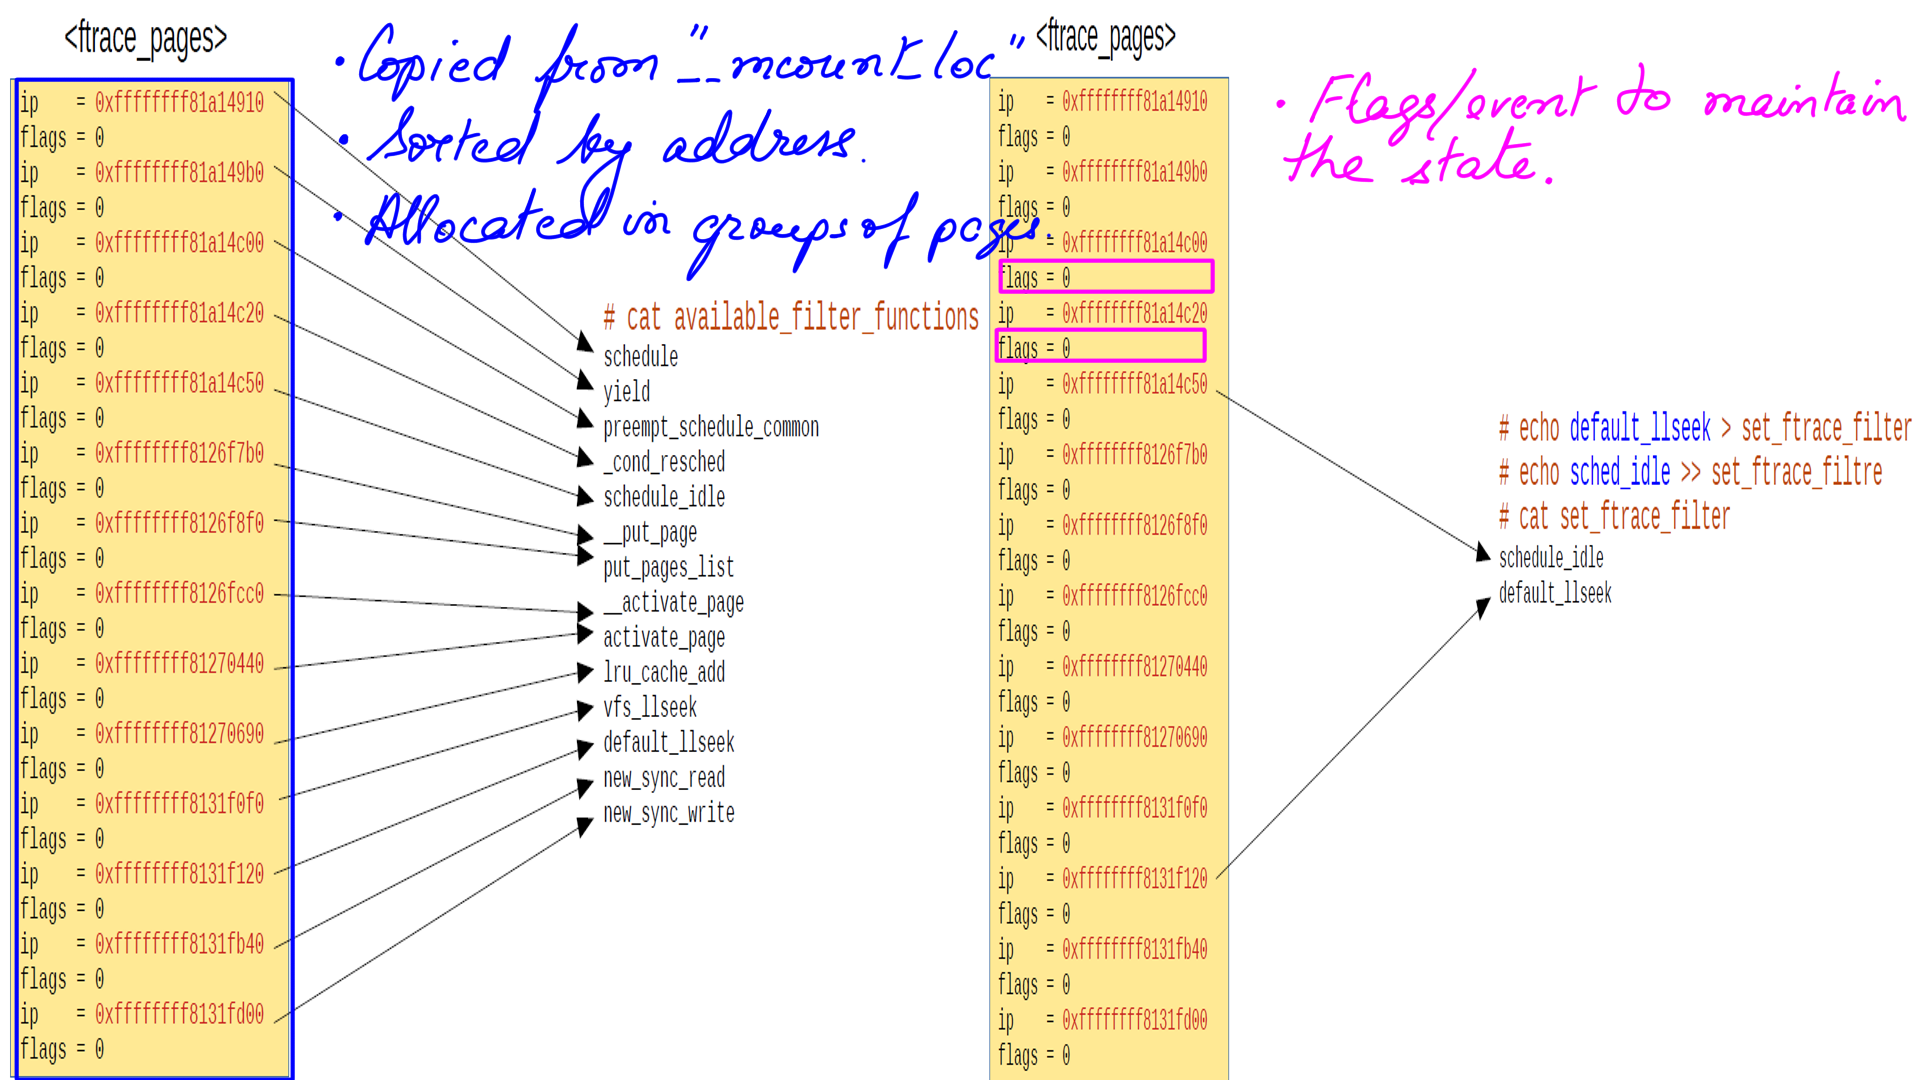
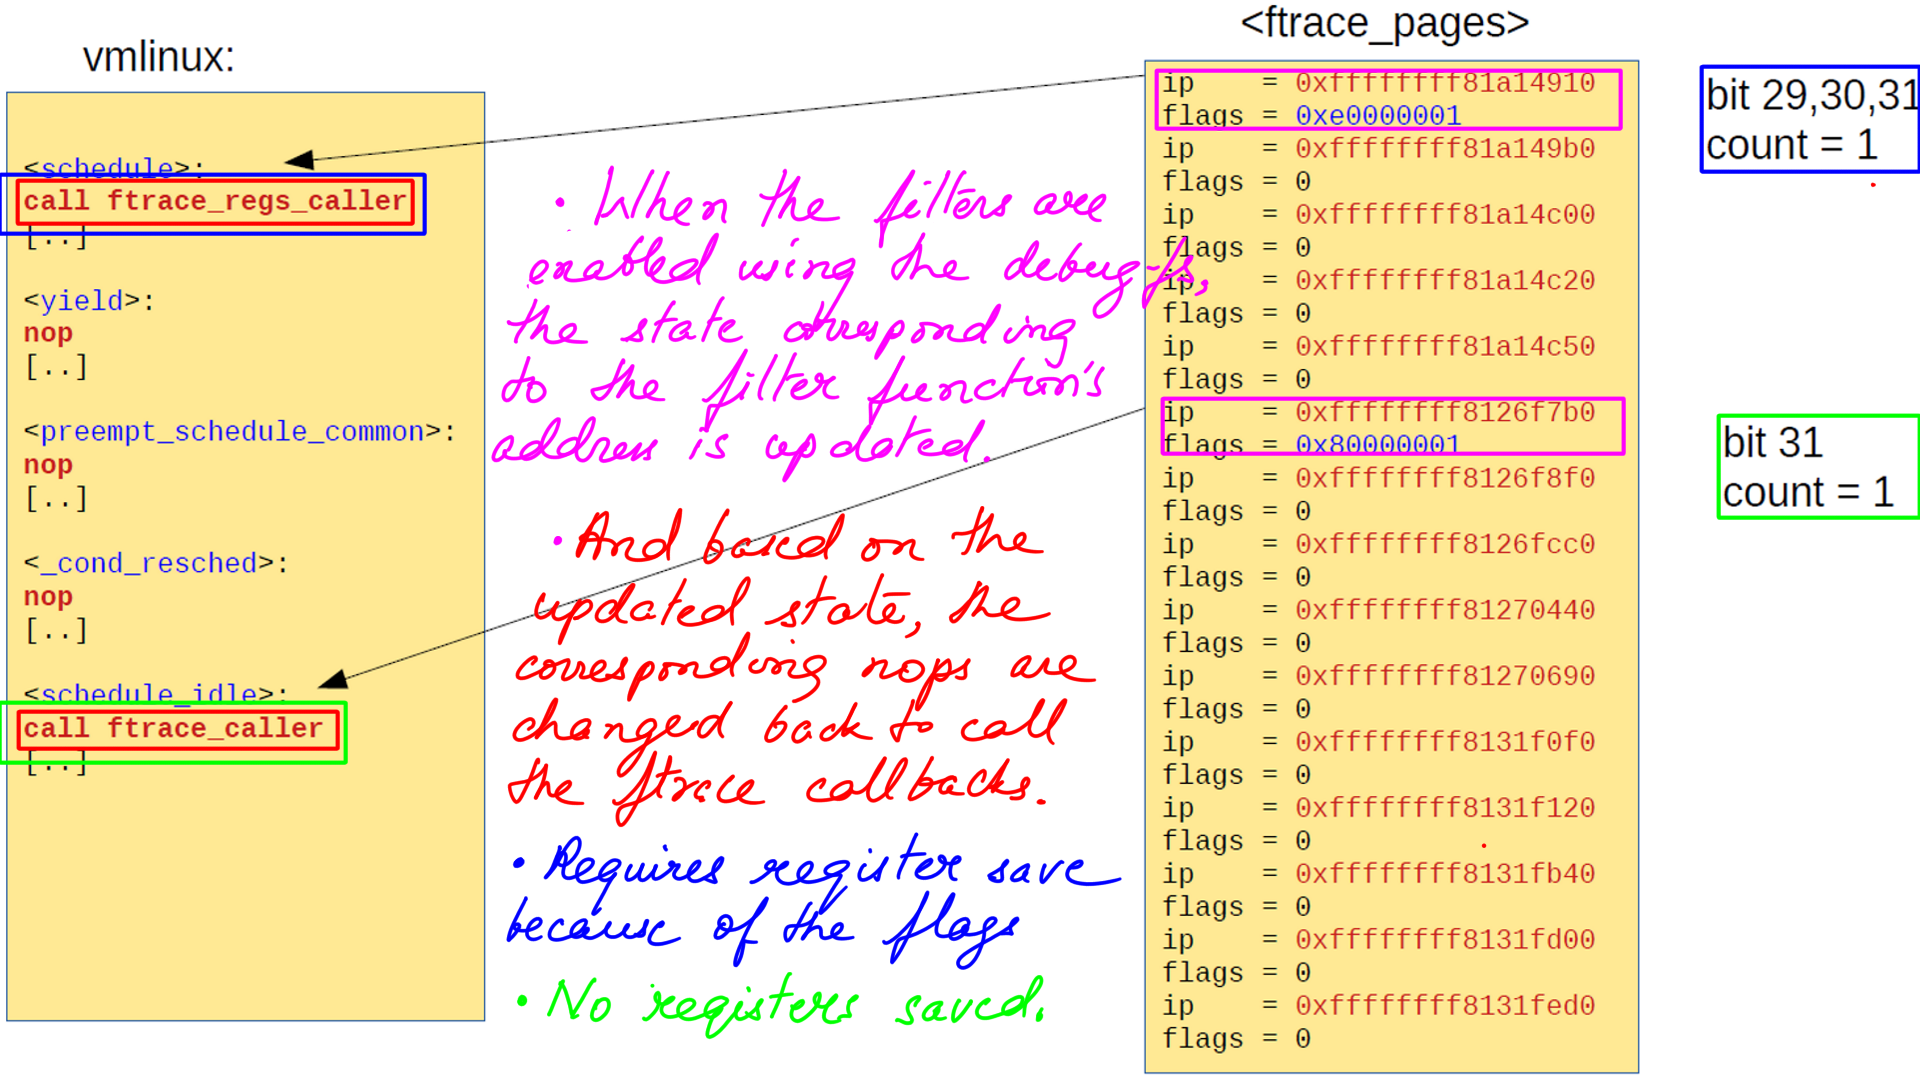
- struct “dyn_ftrace” field flags holds the various flags for ftrace to work. For e.g. Bit 29 is to save the CPU registers while tracing, Bit 30 Needs to call ftrace_regs_caller, and Bit 31 means function is being traced.
- Very long story short, while enabling tracing sometimes CPU registers have to be saved and sometimes not. This results in slightly different ftrace callbacks as shown figure-10.
Linux Tools:Extraction Tools:Ftrace:Summary
Nearly 40 thousand traceable functions in the kernel with negligible overhead is some engineering feet. As you opt-in for events or functions to be traced your overhead goes up in a pay-as-you-go manner. Add to that is the fact that it comes baked in with the kernel. This is not a tutorial of ftrace. Will think of planning one later.
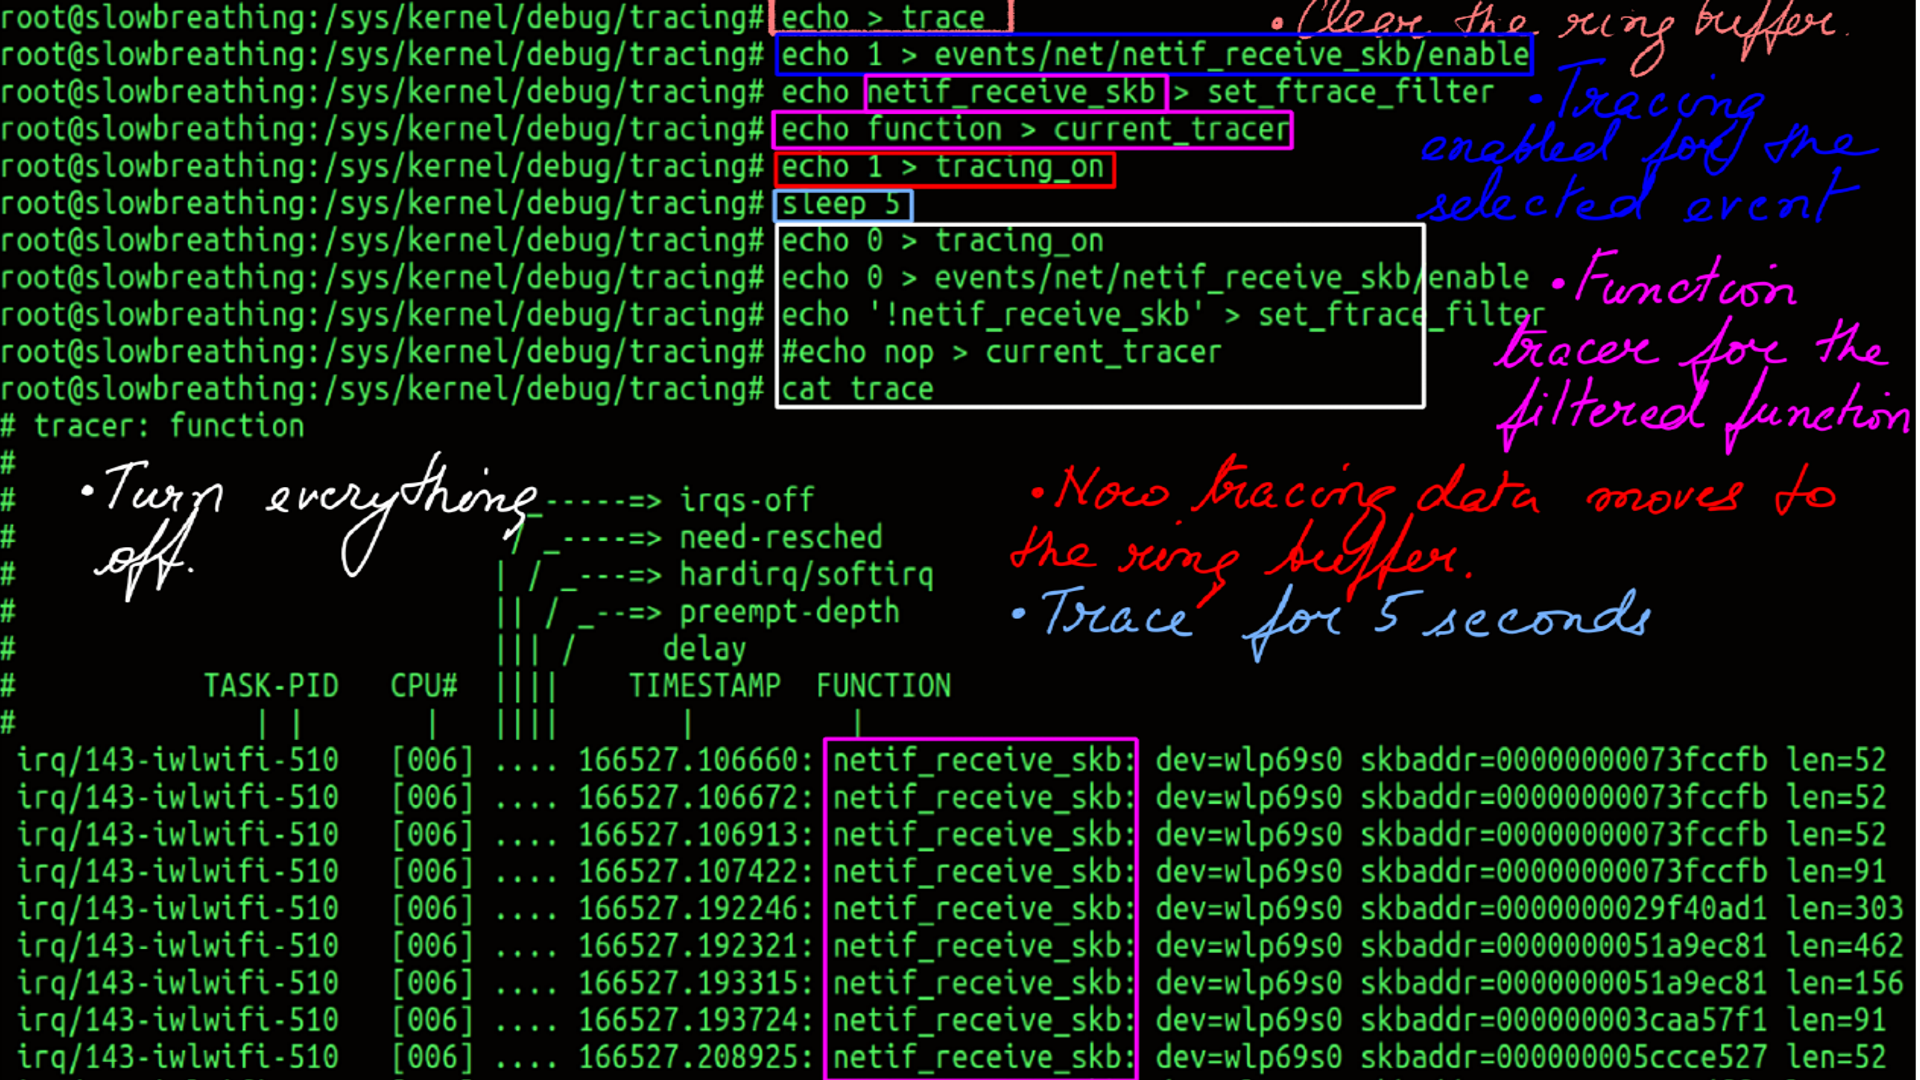
- Can be used with “cat” and “echo”.
- Interface is the tracefs/debugfs usually mounted at “/sys/kernel/debug/tracing”. It may be slightly different depending on your distribution.
- Last but not least, ftrace is not just a function tracer. It is a collection of tracers including Hardware Latency Tracer(hwlat), Wakeup(wakeup) and many more.
- Finally ftrace comes with a few front end tools like the command-line trace-cmd and a visualizer called kernelshark. However, understanding the data captured by a tracer is often much more important. The the subsystem being traced is understood, then the captured data can be post processed to suit any visualizer.
Linux Tools:Extraction Tools:BPF:The most powerful and flexible tracer
EBPF(Extended Berkeley Packet Filters) or just BPF(Berkeley Packet Filters) is like a swiss army knife of performance tools. I am avoiding it’s history completely in the interest of brevity. There is an excellent resource on BPF by one of it’s authors. To be more precise, the author of tools like bcc and bpftrace built on top of BPF. As an aside, the only thing that does not resonate with me is its name(BPF…Really?? ). We could have a more attractive name but I guess that horse has already bolted. It is a highly capable tool and is one reason why it is a bit difficult to explain. This post is about it’s engineering, what makes it capable and a few examples to illustrate it superpowers over other tools.
BPF has many capabilities. But here we focus on a couple of it’s defining features.
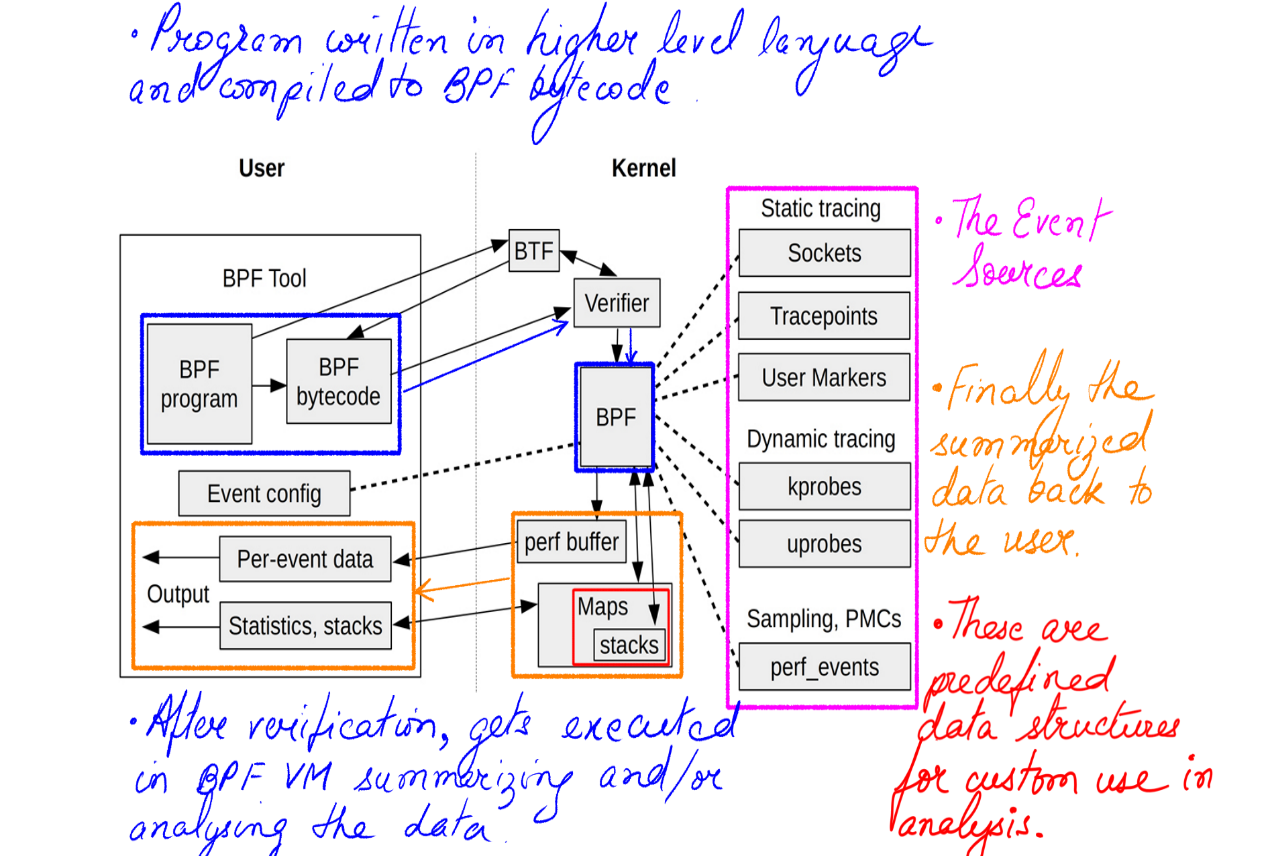
- It’s ability to post-process data in kernel safely and securely in a BPF Virtual Machine.
- It’s In Kernel rich Data Structures for ease of processing.
- It’s detailed Stack Trace Walking
Linux Tools:Extraction Tools:BPF:BPF Virtual Machine
- The post-processing carried out by BPF Virtual Machine has been attempted by many techniques before. One such technique was to use kernel modules. However, they were all not safe in production because they were all executed in a running kernel with practically no checks.
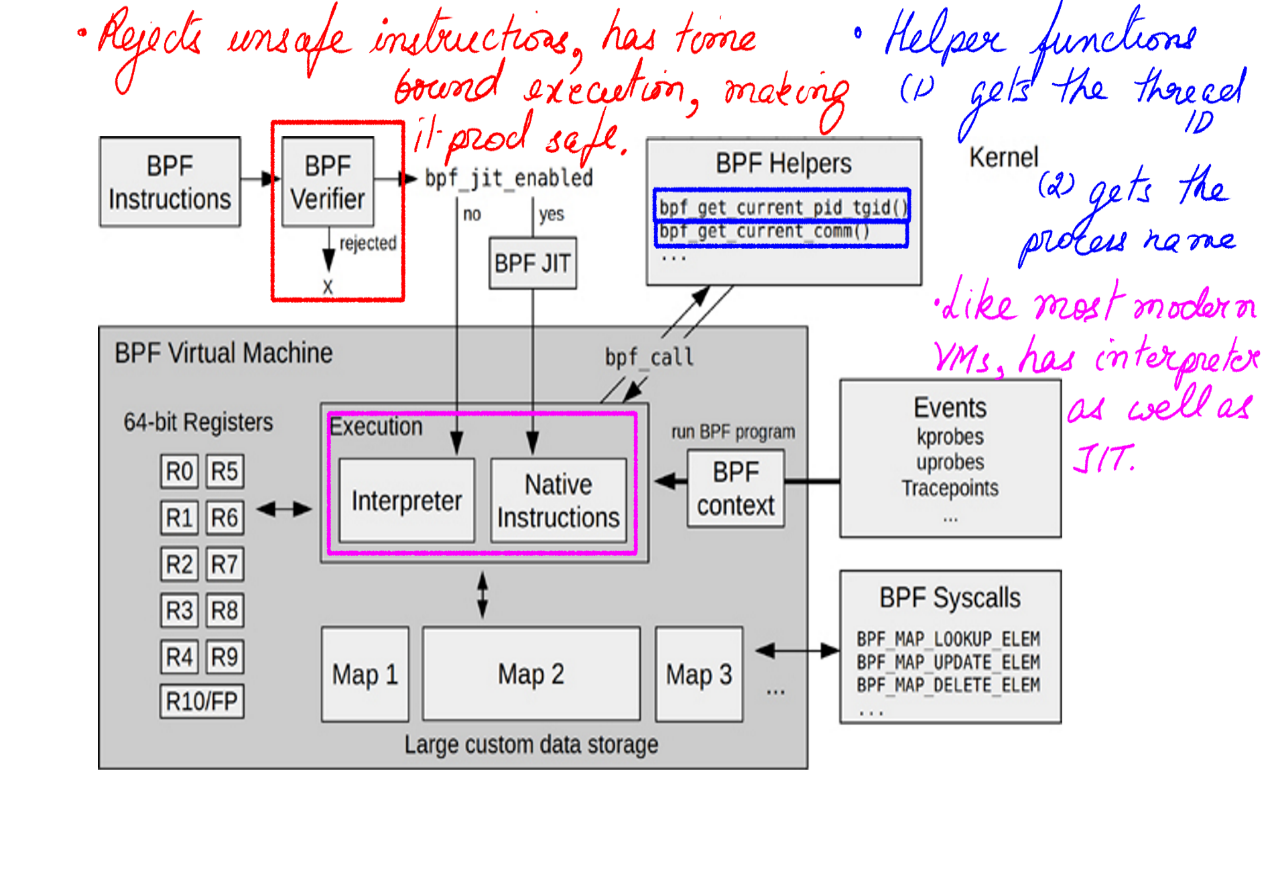
- BPF provides a BPF Virtual Machine with a verifier that checks for harmful code before executing them.
- The BPF Virtual Machine has a verifier that reject unsafe operations.
- A Virtual Machine does not necessarily mean slow execution.
- A JIT compiler generates native instruction for direct and faster execution.
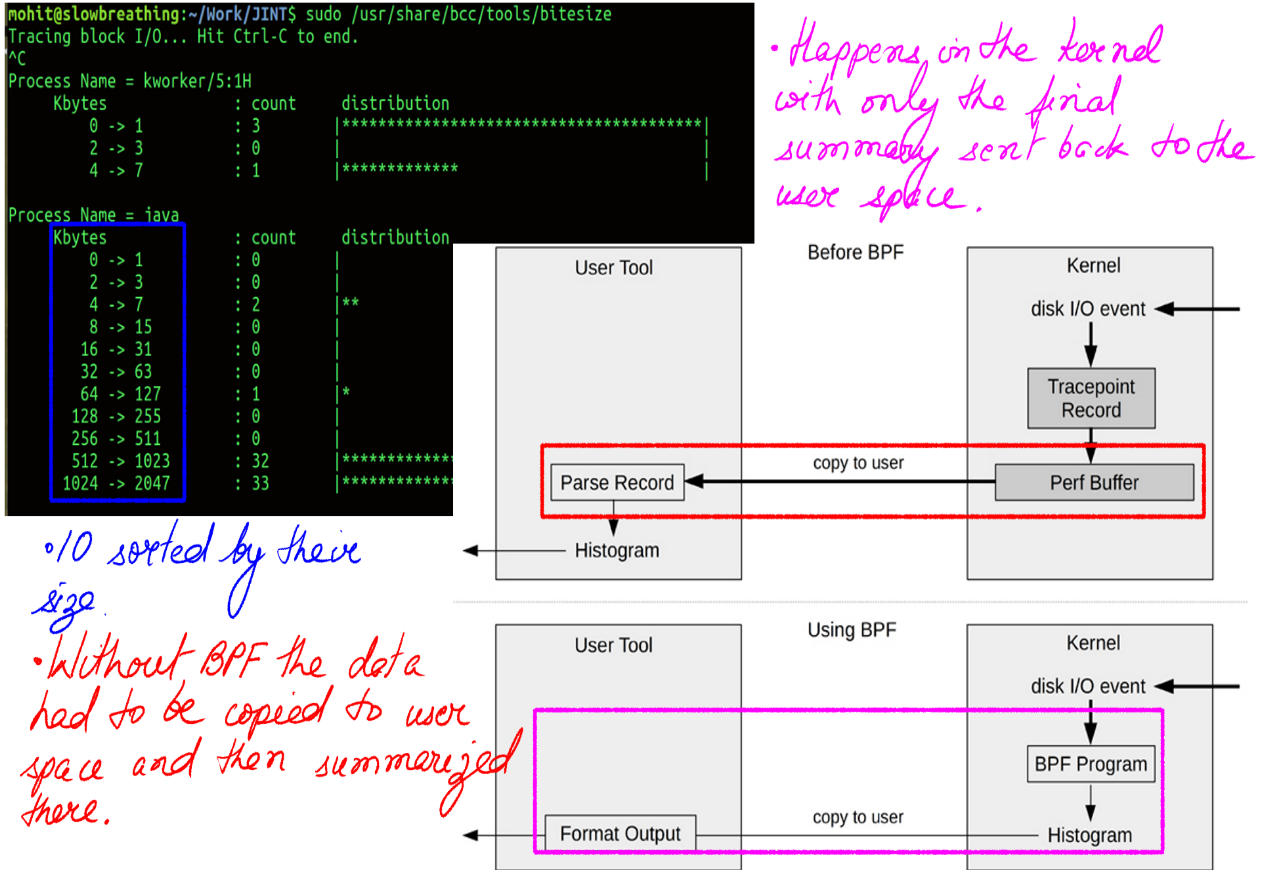
- Figure-14 shows a classic BPF before and after example.
- In kernel summary and in general in kernel pre/post execution/processing opens up enough and more avenues for making excellent tools for all kinds of purposes.
Linux Tools:Extraction Tools:BPF:In Kernel rich Data Structures
BPF provides rich data structures via maps(Figure-12,13), histograms(Figure-12,13), e.t.c to process in kernel summaries. Many tools like Perf can gather data from PMCs but they have to push it the user space to be post-processed. What this means is a lot more data get transferred to the user-land. With rich data structures and in-kernel processing, this can be minimized. Also, the ability to in-kernel processing by itself is awesome and opens up huge possibilities.
Linux Tools:Extraction Tools:BPF:Stack Trace Walking
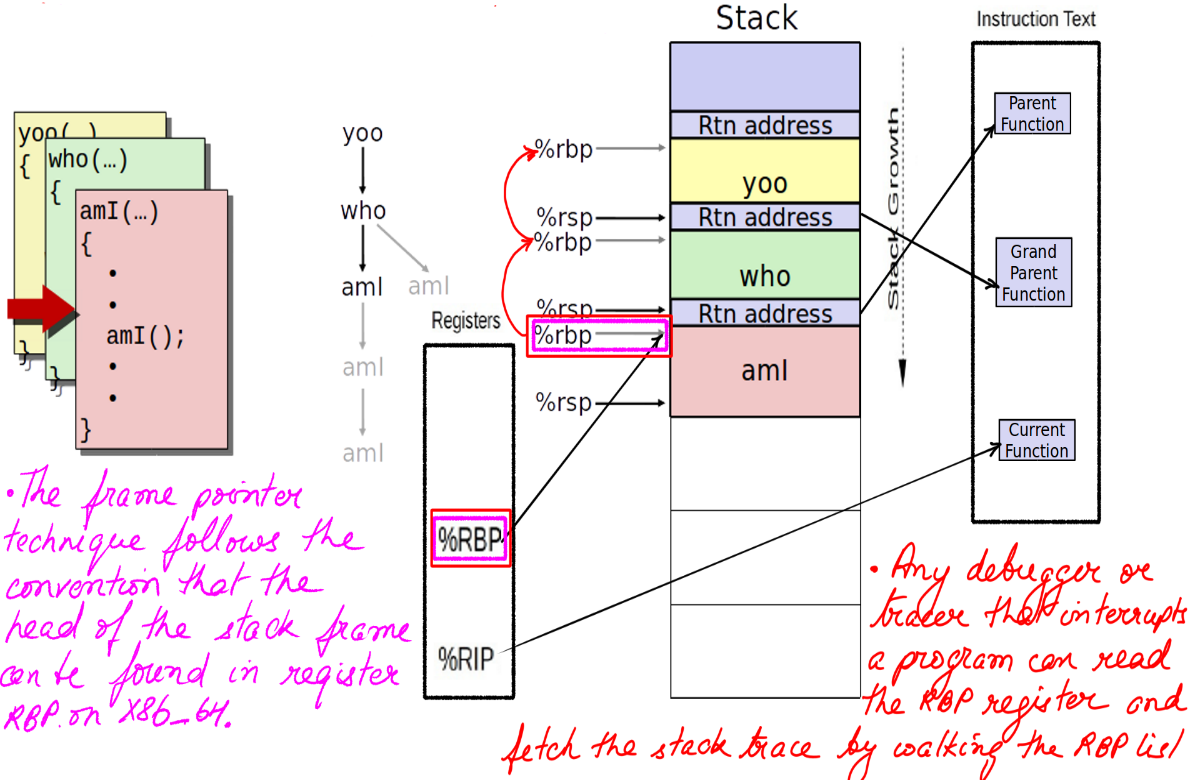
Stack traces are an invaluable tool for understanding the code path that led to an event, as well as profiling kernel and user code to observe where execution time is spent. While there are other ways to walk the stack, framepointer based stack walking is quite popular and BPF uses it.
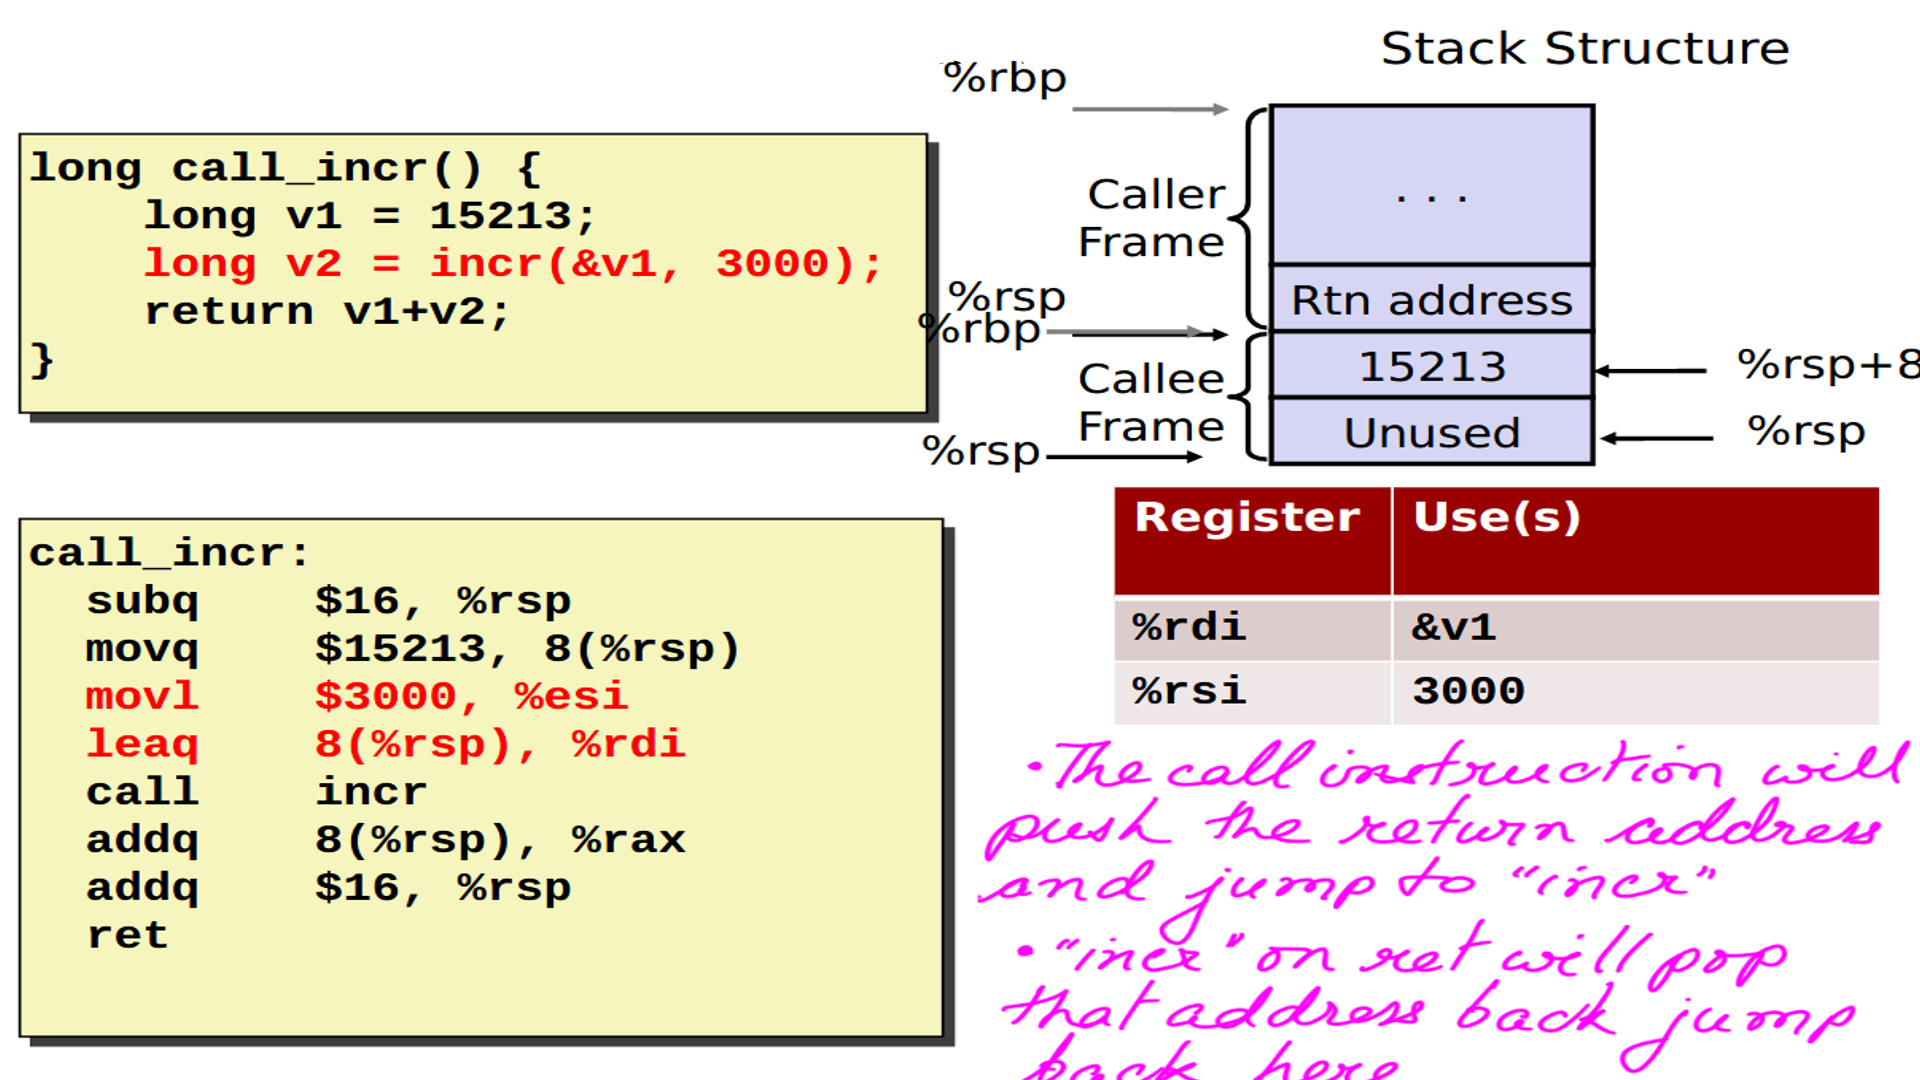
- This is how a call is setup in X86.
- The figure-15 depicts the address to jump back to when the callee has finished execution.
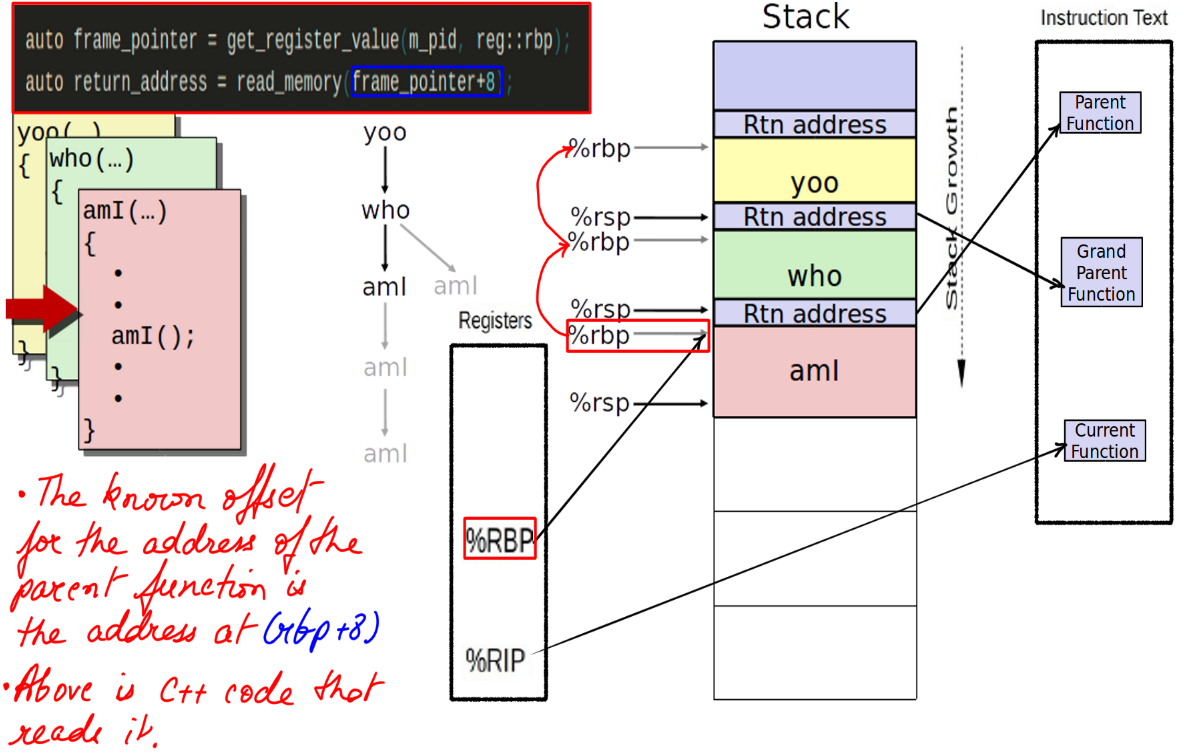
- This figure-16 depicts the stack trace walking using frame pointers.
- This will show the trace leading up to the event.

- Some code in C++ to traverse the frame, however, this would usually be acomplished by a tool. BPF in our case.
Linux Tools:Extraction Tools:BPF:A defining example
This example explores the tracing of kernel function and even traversing and processing kernel structures. This would not have been possible earlier without compromising the safety of the kernel. BPF makes this possible.
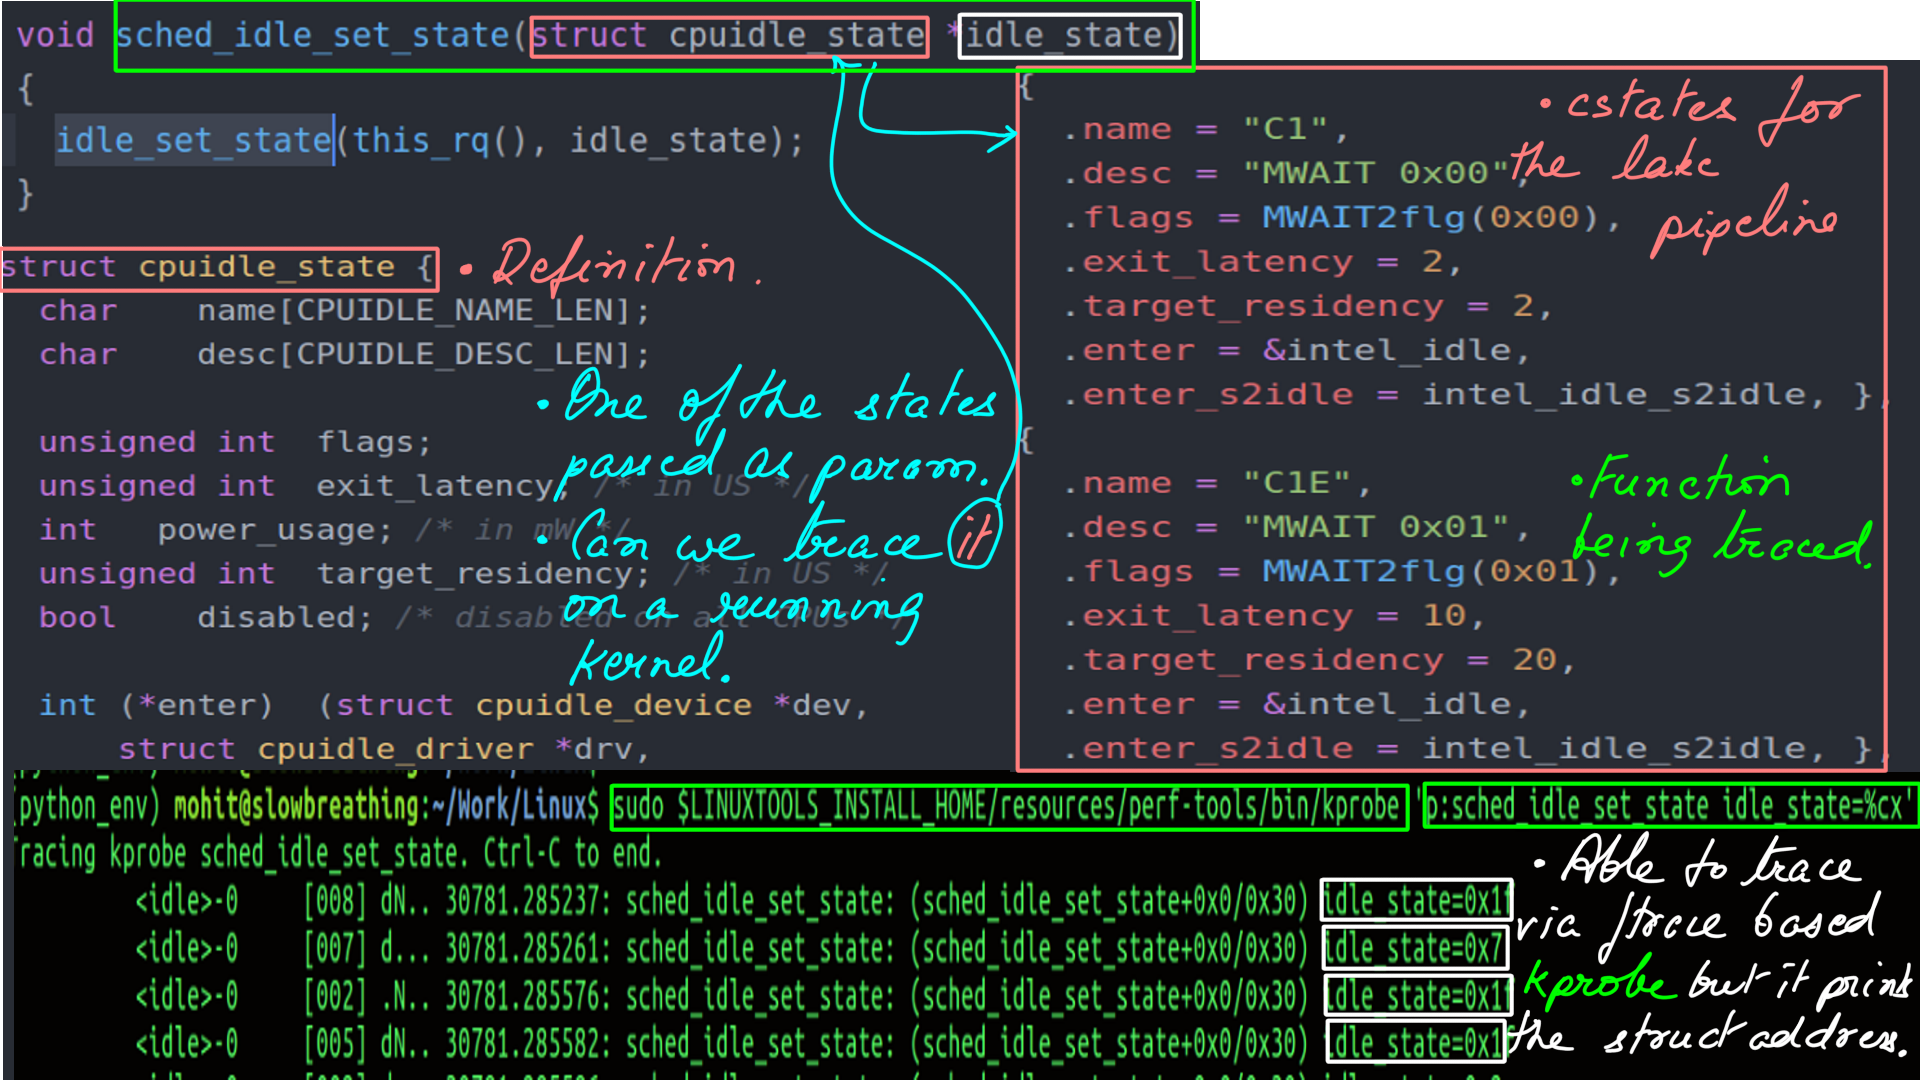
- Consider “sched_idle_set_state” kernel function. It is a part of CPUIDLE generic driver interface. It takes the struct “cpuidle_state” as parameter.
- Tracing the above function with ftrace I am only able to access the “cpuidle_state” parameter as an address as it is a structure that is of no practical use. This is illustrated in figure-18 below.
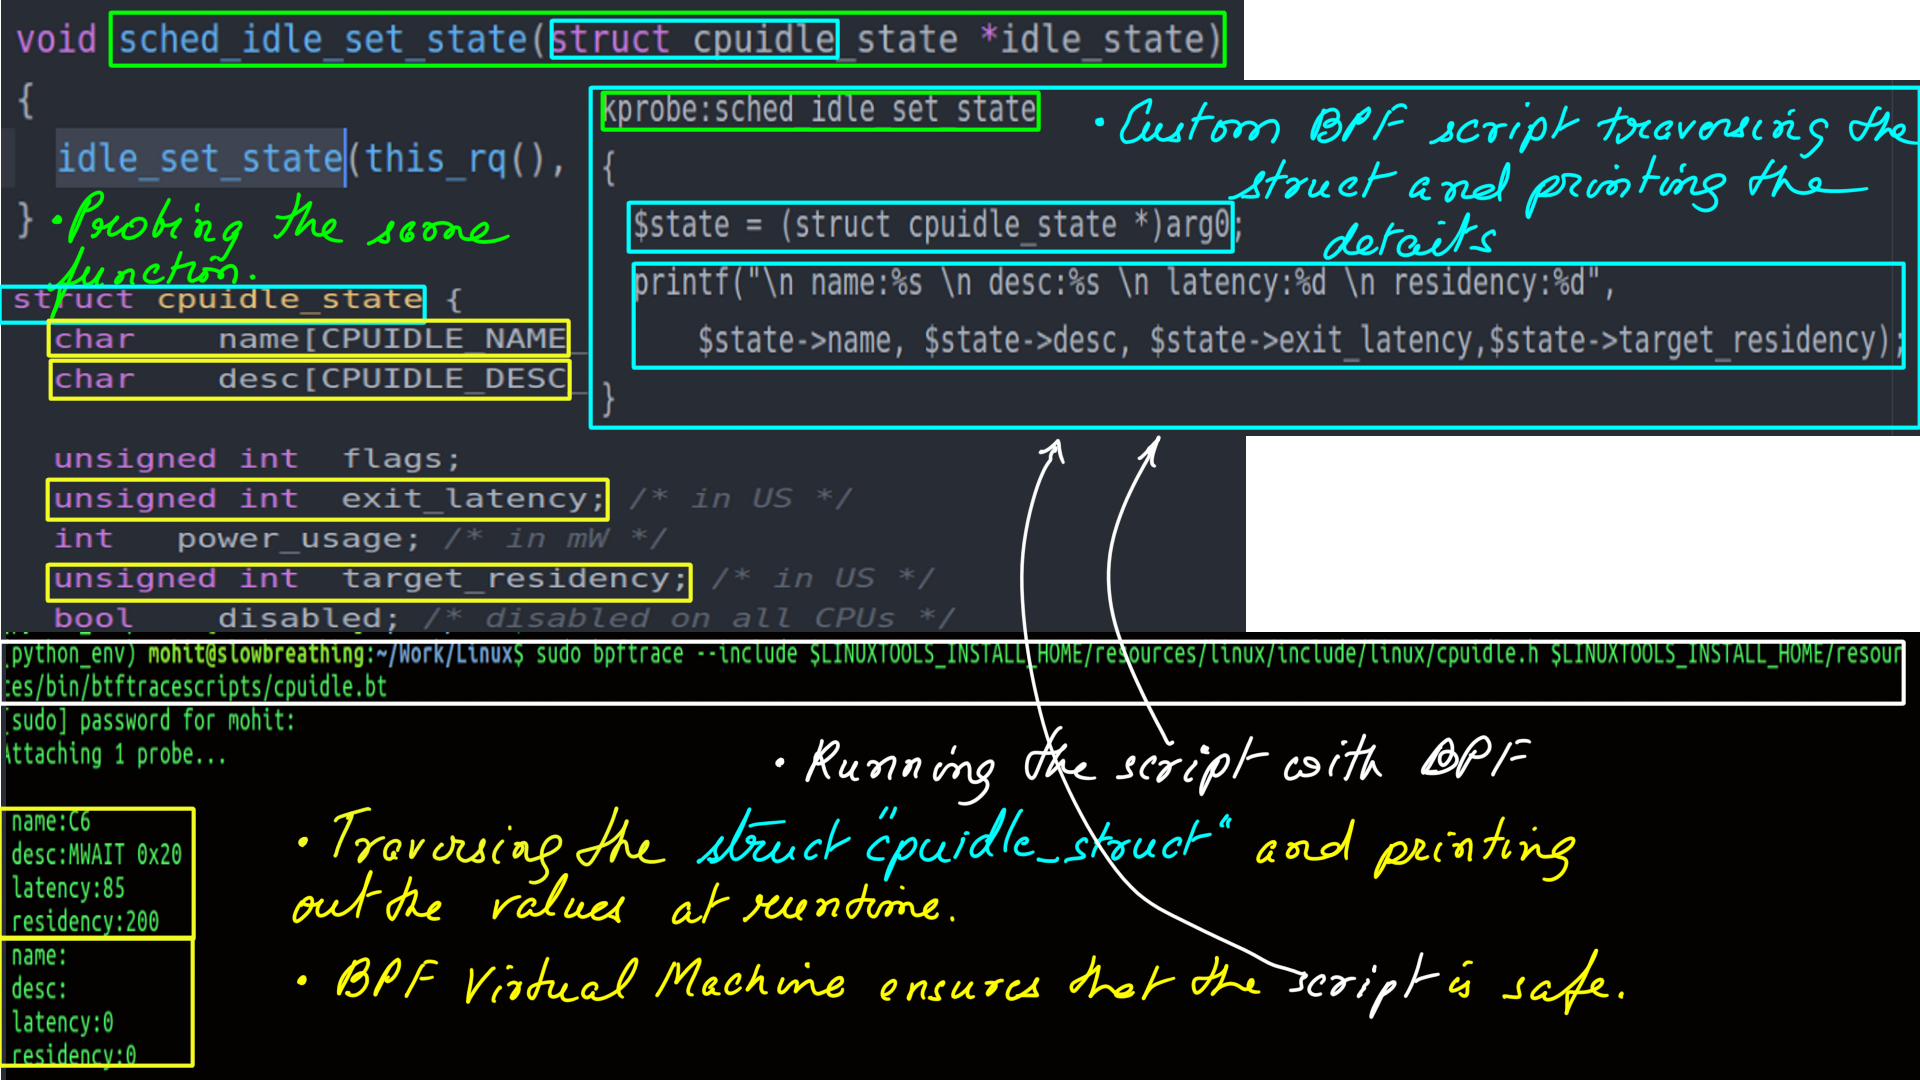
- Identical setup as above, except this time I use a BPF script to trace and traverse the struct “cpuidle_state”.
Linux Tools:Extraction Tools:Ftrace:Summary
BPF performance tools make use of many technologies, including extended BPF, kernel and user dynamic instrumentation (kprobes and uprobes), kernel and user static tracing (tracepoints and user markers), and perf_events.
Summary
These are not the only tools. There are a couple of notable omissions. The biggest one being Performance Monitoring Counters as an event source and PERF and an extraction tool. It is a frequency-based profiling tool and something we use heavily as one can control the frequency of recording to vary the overhead of the recording being done.
In summary, these are tools that we take to the trenches of performance tuning and monitoring. The important thing being that if used right they have the capability to transform your understanding and take it to the next level. By the next level I mean, the ability to use this information to impress upon the design stage of your application.
“ftrace” for example is an always installed (on most Linux distributions) and can be used with just “echo” and “cat”. Yes, It does not have a fancy UI but the captured data can be post-processed to be rendered by any visualizer. Here are few sample csv files(file1,file2).
[BPF] is a different beast altogether. It can look inside the kernel and most userland applications including Java/JVM python with kprobes/uprobes/USDTs respectively. It’s safe in-kernel/in-application processing is a powerful feature that lends modern Linux Kernel it’s amazing superpowers.
References
- What every programmer should know about memory: (This is a definitive 9 part(the links for the rest of the parts are embedded in the first one.) article on how the hardware works and, how software and data structure design can exploit it. It had a huge impact on the way I thought and still do think about design. The article first came out in 2007 but it is still relevant which is proof that basics don’t change very often.)
- Intels documenation: (Intel’s documentation is the authentic source here. But, it is incredibly difficult to read. It is as if Intel’s employees were given a raise to make it “impossible to comprehend” kind of document.)
- Agner Fog: (He benchmarks microprocessors using forward and reverse engineering techniques. My bible.)
- Linux Source: (If you are going to trace your programs/applications then having the Linux source is a must. Tracers will tell you half the story, the other half will come from here. )
- Transformer: (Modern Natural Language processing, in general, must be indebted to Transformer architecture. We however, use an asymmetric transformer setup.)
- Performer-A Sparse Transformer: (This is as cutting edge as it can get. The transformer at the heart of it is a stacked multi-headed-attention unit. As the sequences(of words or System events or stock prices or vehicle positions e.t.c.) get longer, the quadratic computation and quadratic memory for matrix cannot keep up. Performer, a Transformer architecture with attention mechanisms that scale linearly. The framework is implemented by Fast Attention Via Positive Orthogonal Random Features (FAVOR+) algorithm.)
- Ftrace: The Inner workings ( I dont think there is a better explaination of Ftrace’s inner workings.)
- Ftrace: The hidden light switch: ( This article demonstrates the tools based on Ftrace.)
- BPF: ( eBPF or just BPF is changing the way programming is done on Linux. Linux now has observability superpowers beyond most OSes. A detailed post on BPF is the need of the hour and I am planning as much. In the meantime, the attached link can be treated as a virtual BPF homepage.)