Meditating with microprocessors
- Artificial Intelligence based Hardware(Microprocessor) tuning: Implementing a very simple idea (part-1)
- A crashcourse in Microarchitecture and Linux CPUIDLE interface (part-2)
- Trading off power for UltraLowLatency (part-3)
- Artificial Intelligence guided Predictive MicroProcessor tuning (part-4)
- Introduction
- Is there a solution?
- Is there a smarter solution?: Artificial Intelligence model based proactive decision making
- Recognizing the pattern
- Transformer as the backbone
- Transfer Learning inspiration from NLP
- Fine tuning pre-trained networks
- Artificial Intelligence model based proactive and predictive decision making
- The Final Cut
- Summary
- Appendix:Tools of the trade (part-5)
Introduction
The current article is part of a bigger series titled Meditating-with-microprocessors, in which I demonstrate the use of Artificial Intelligence to tune microprocessors for Ultra Low Latency and Realtime loads. There are 5 parts to the series, Meditating with Microprocessors: An essentially simple idea(part-1) , A crashcourse in Microarchitecture and Linux CPUIDLE interface(part-2), Trading off power for UltraLowLatency (part-3) , Artificial Intelligence guided Predictive MicroProcessor tuning (part-4), Appendix:Tools of the trade (part-5). In the current article, I present irrefutable evidence that if the processor is configured correctly with a goal in mind(for e.g. UltraLowLatency), the OS jitter caused by the processor can nearly be eliminated. The system can be much more predictable. Furthermore, It has a huge impact on the latency of the system for good. A substantial improvement in latency due to configuration on the Core, but beyond substantial due to Uncore. The improvement due to Uncore is to be expected because there is a whole lot more circuitry on the Uncore. However, this is a trade off that comes at the cost of expending more power.
Core and Uncore:Core
We’ll look at Core and Uncore again but this time from the perspective of the power interface. How much Power can be saved and how much is the tradeoff in terms of latency.
- On the core we have L1(data), L1(instruction), L2, Execution-units, and a whole lot of buffers. Maybe, you could quickly refresh the discussion on Core before you proceed.
- On the uncore we have L3 cache, integrated memory controller, QuickPath Interconnect (QPI; for multi-socket communication), and an interconnect that tied it all together. In the Sandy Bridge generation over and above Sandy Bridge, PCIe was integrated into the CPU uncore.
- The complete package is called a package(core + uncore). core + uncore=package
Power
Active power of the CPU is when executing logic it transitions between ‘0’ and ‘1’. The transistors are charging and discharging to represent states. There are 2 primary components
- The power that runs the clock of the CPU
- The power consumed by execution of logic
There are 2 ways to save power.
Power:Turn things off
Within the CPU there are 2 ways of doing this. (1) Clock gating stops the clock, saving active power. The latency incurred is approximately 10ns-1μs. (2) Power gating removes all power, saving both leakage and active power. The latency incurred is approximately 1μs-10μs.
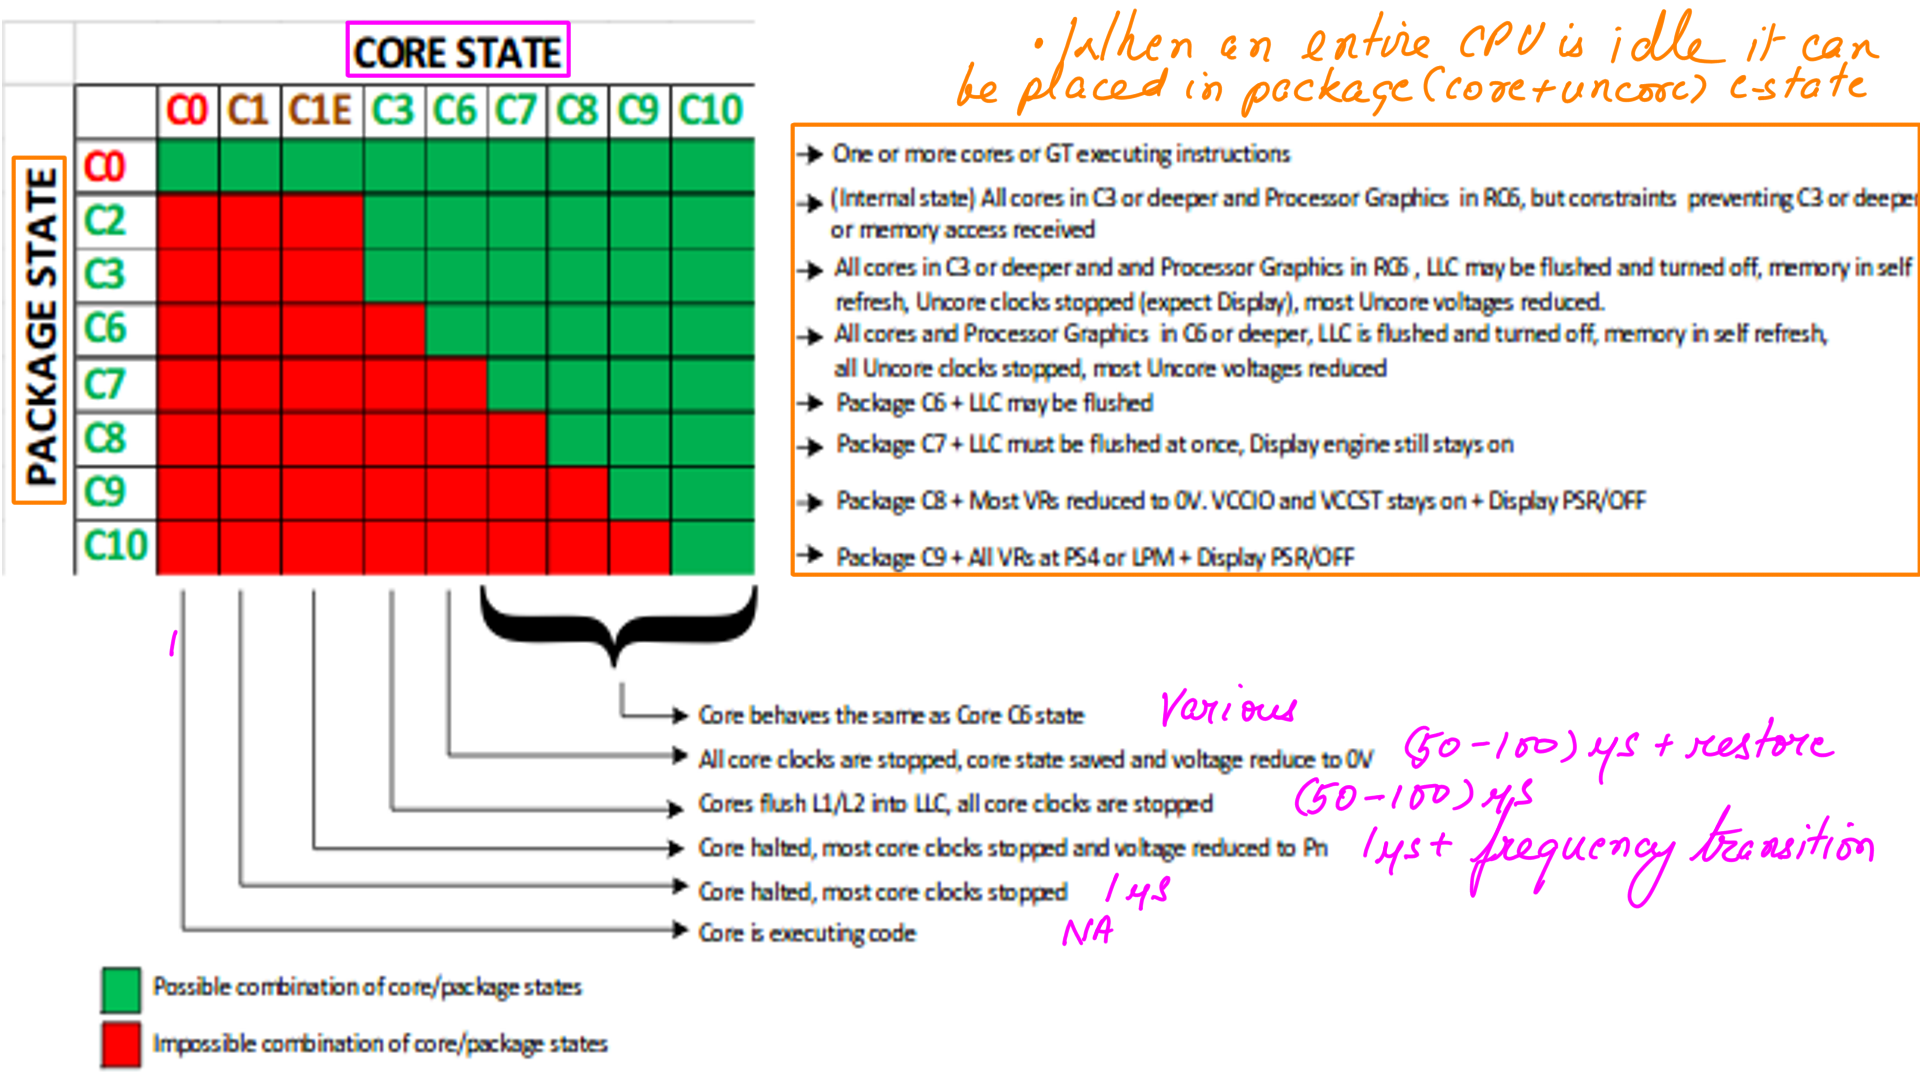
Power:c-states
Core c-states and package(core+uncore) c-states. Abbreviated as cc-states(c-states) and pc-states. So CPU designers have developed ways for the processor to go into a lower-power state when there is nothing for it to do. Typically, when put into this state, the CPU will stop clocks and power down part or all of its circuitry until the next interrupt arrives. Intel servers commonly target a worst-case of about 40 microseconds in order to restore the path to the main memory for PCIe devices.
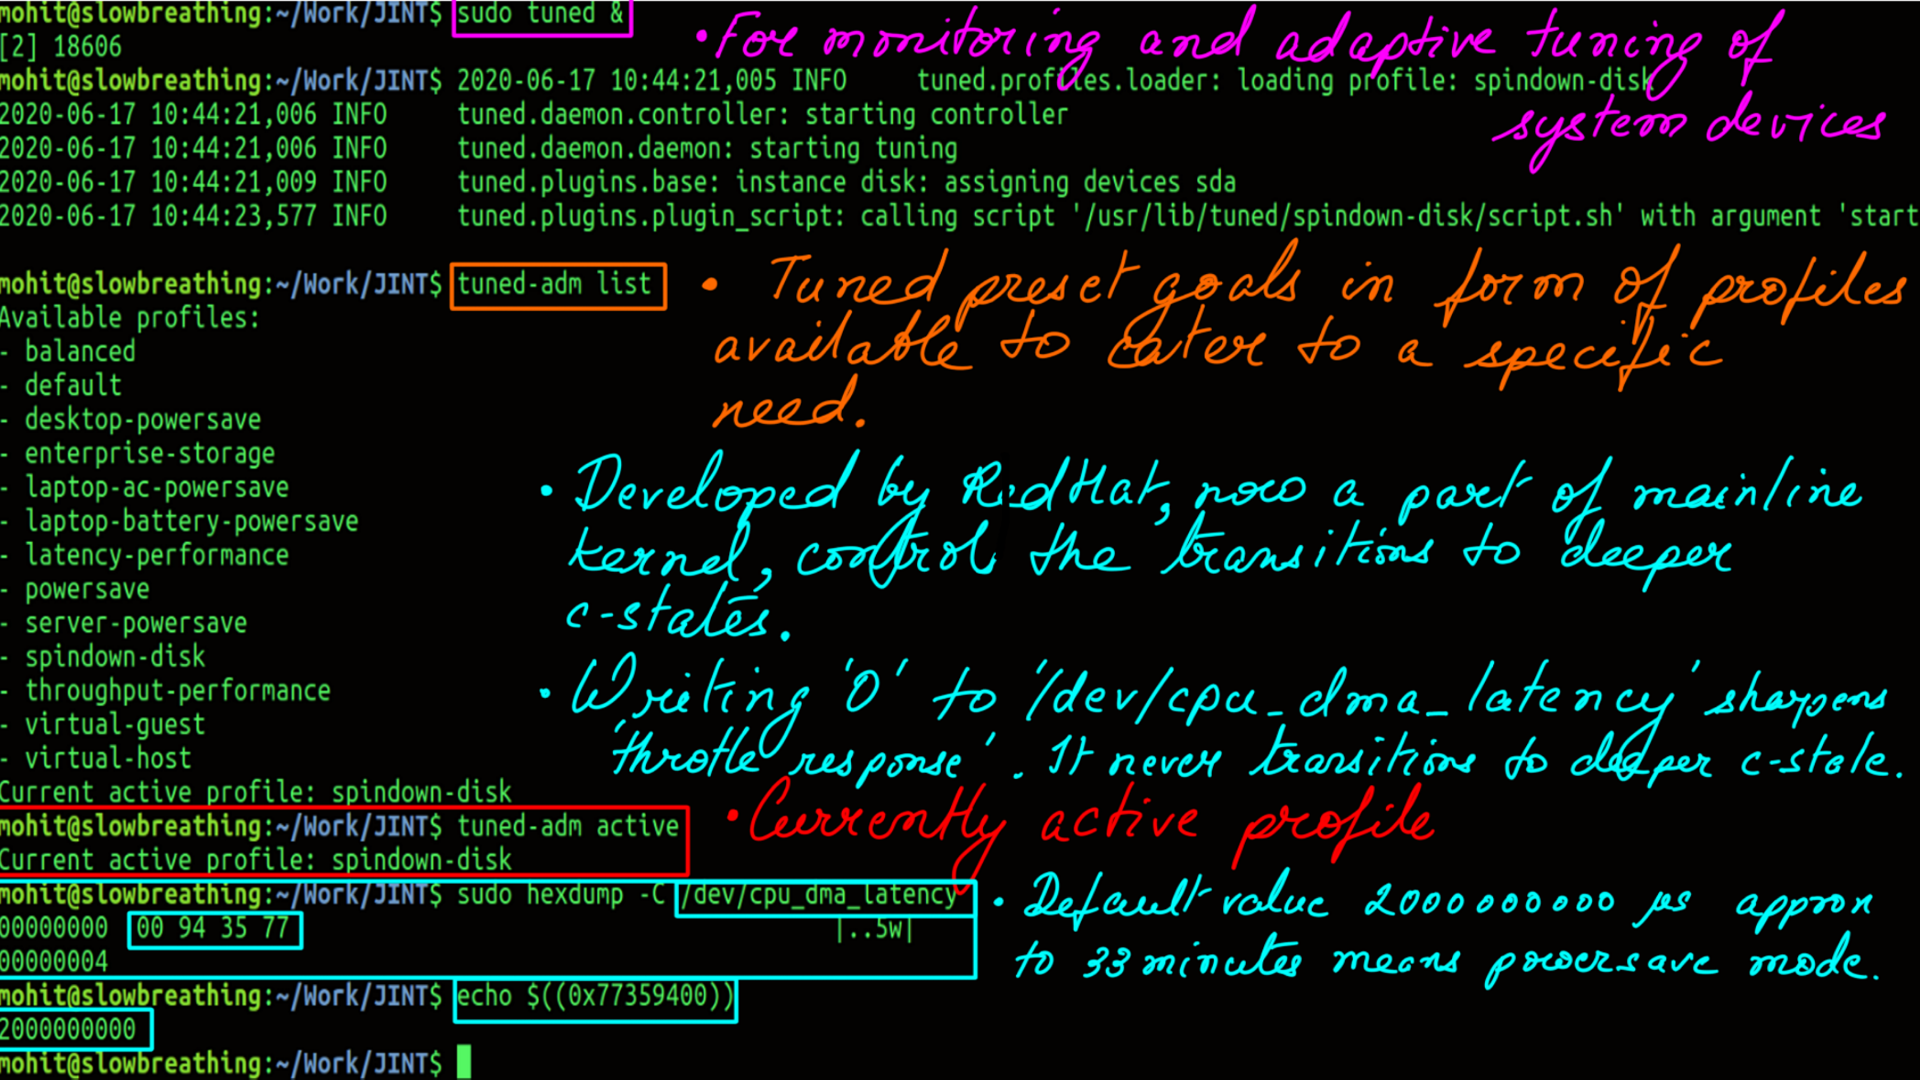
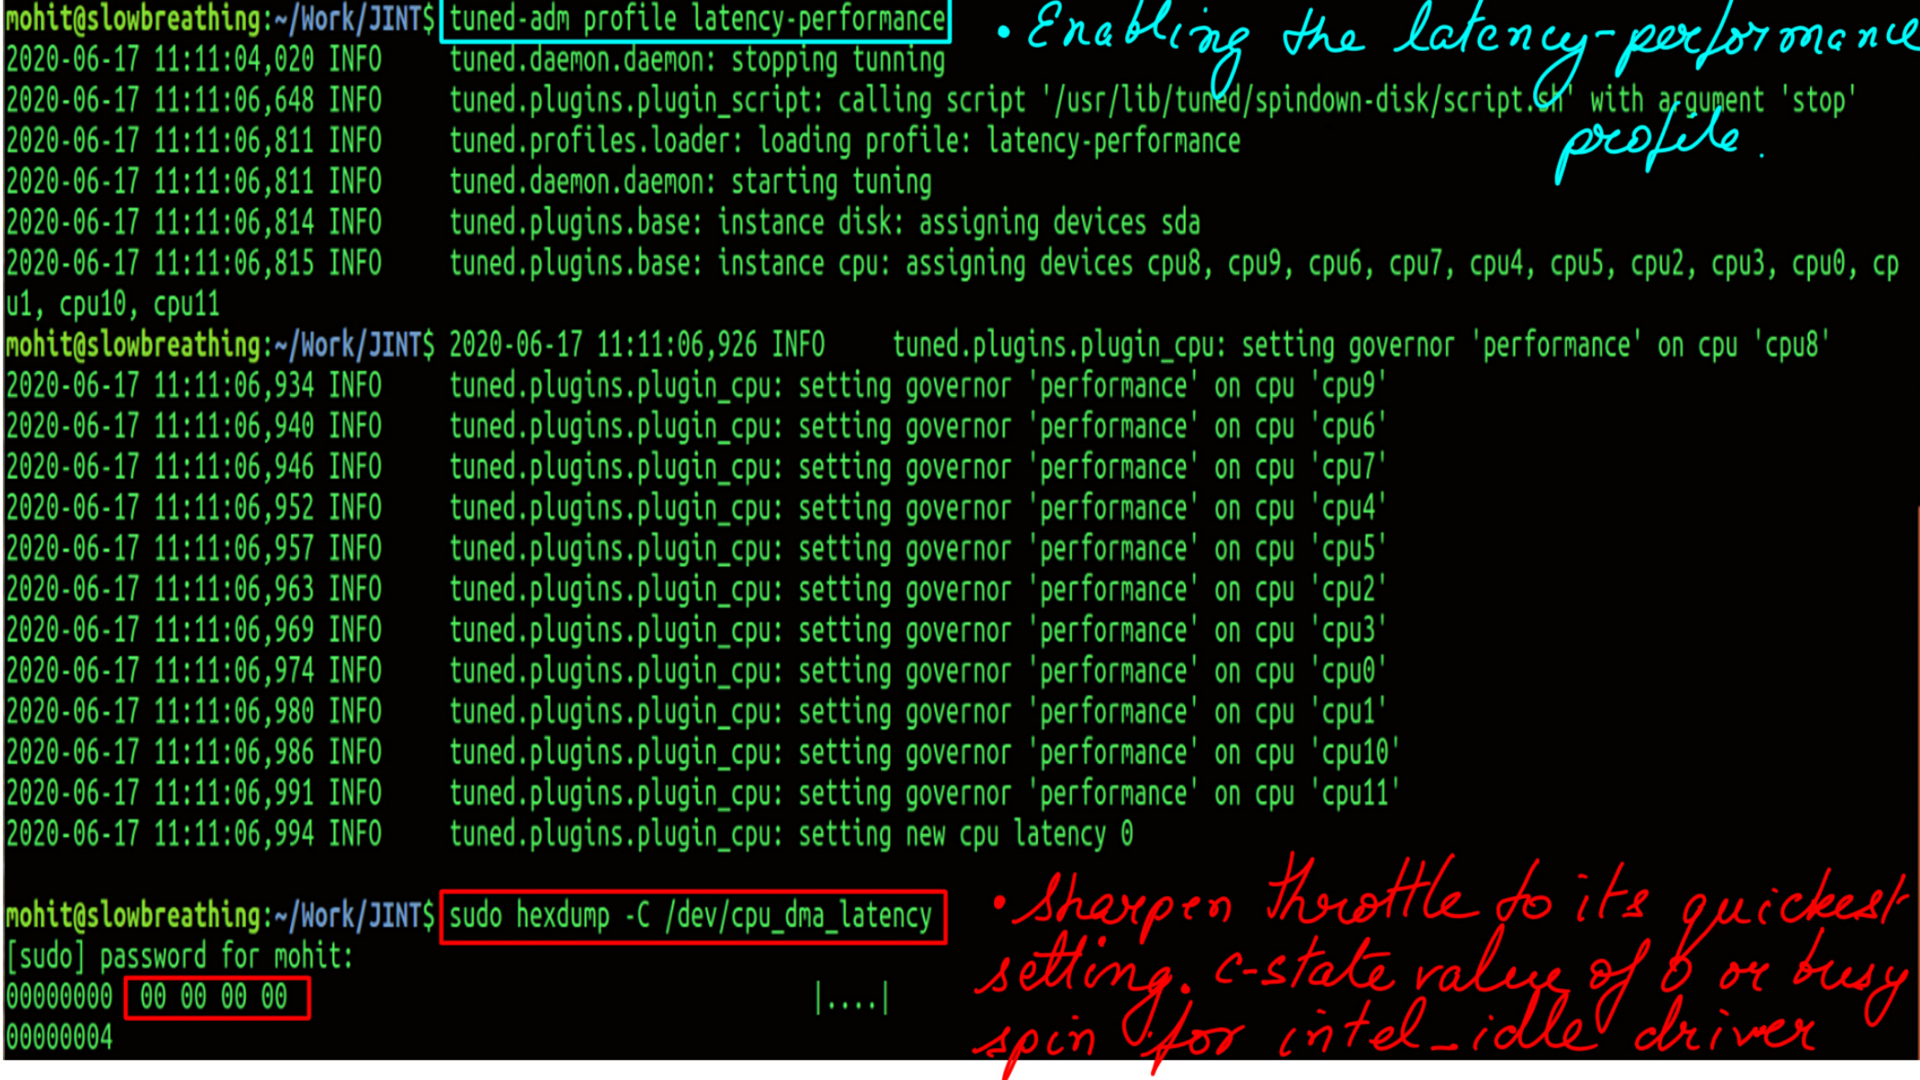
Power:Tuned
Tuned-adm, developed by Redhat, allows tuning of certain settings in the operating system to suit certain use-cases. There are many predefined profiles to cater to common use cases. Custom profiles can also be defined from scratch or built on existing profiles. Few example profiles are “Low latency for storage and network”, “high throughput for storage and network” etc.
- List of profiler.
- Active Profile is spindown-disk.
- “/dev/cpu_dma_latency” is the response time for the cpu in the current configuration.
- Active Profile is latency-performance.
- “/dev/cpu_dma_latency” is the response time for the cpu in the current configuration.
Power:Tuned:c-states requests
But does this change have an impact on c-state request. Measurements are done using an excellent tool called turbostat.
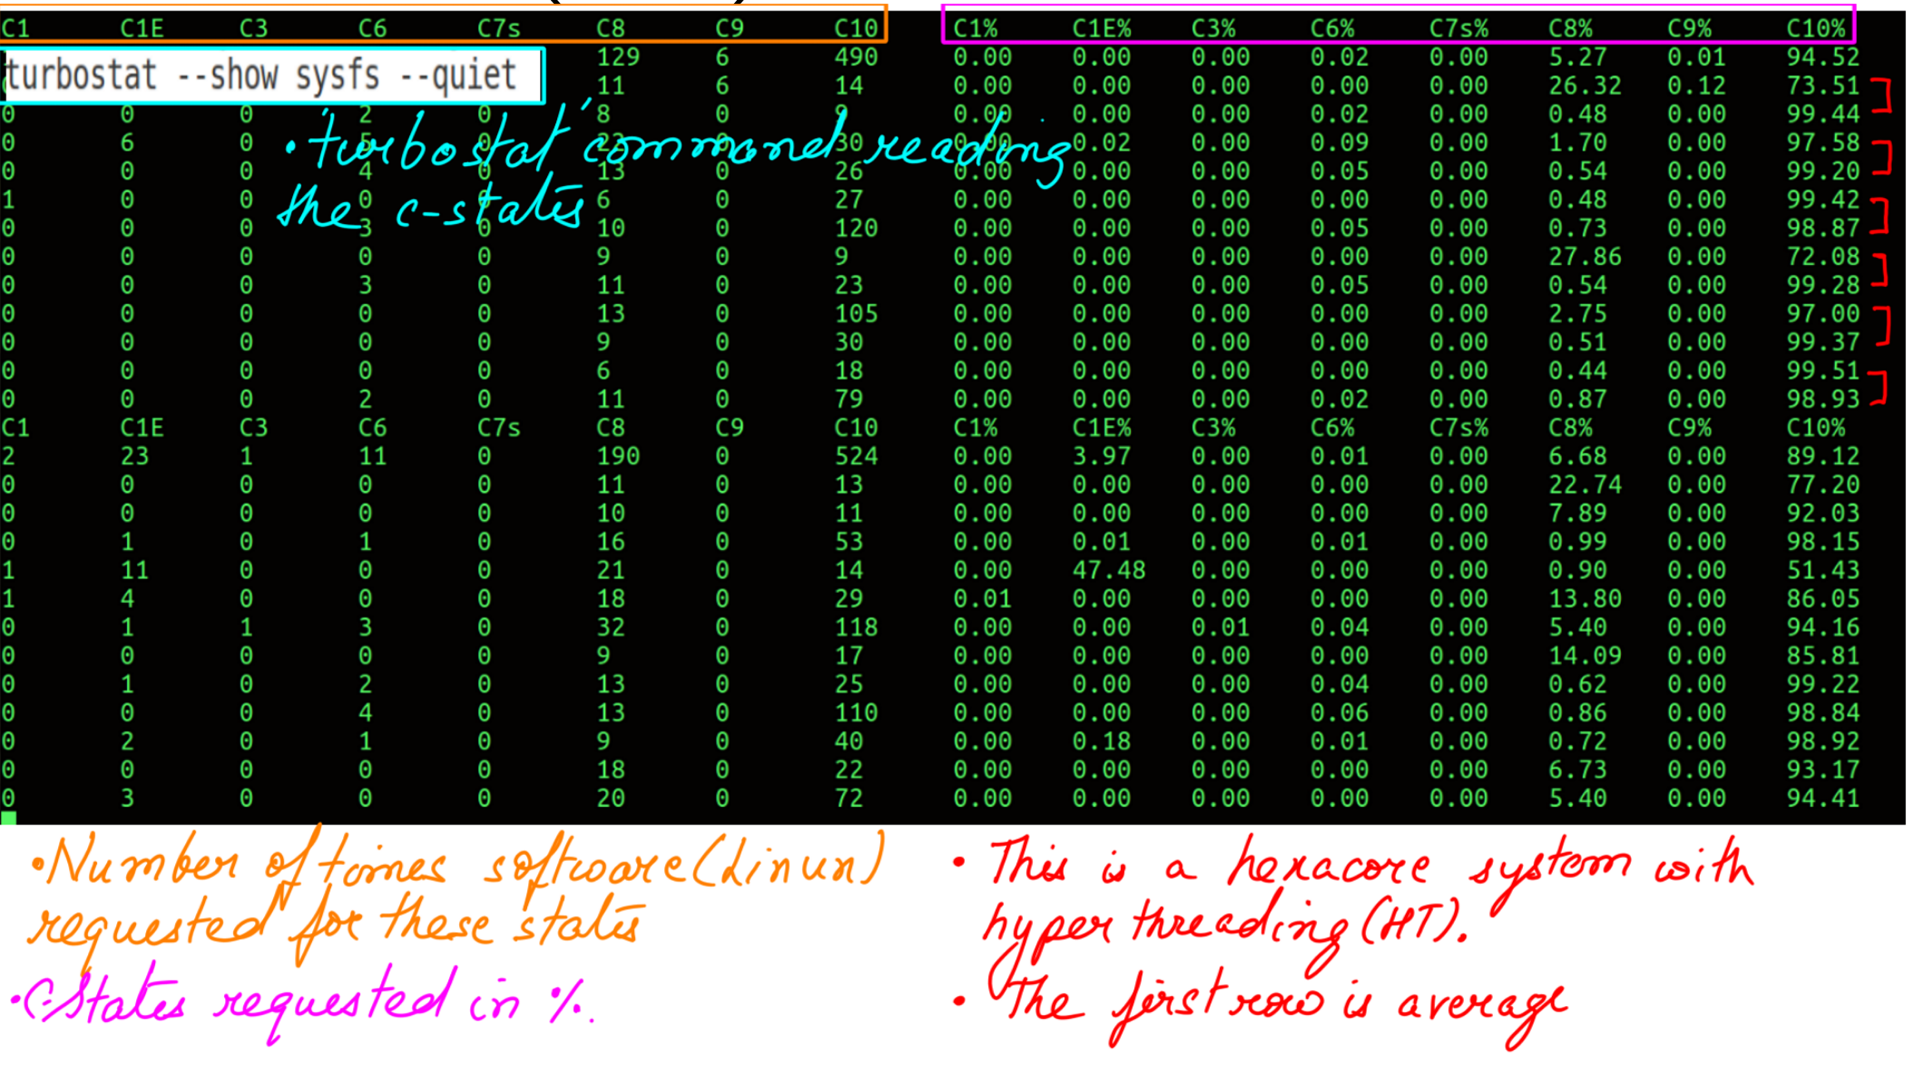
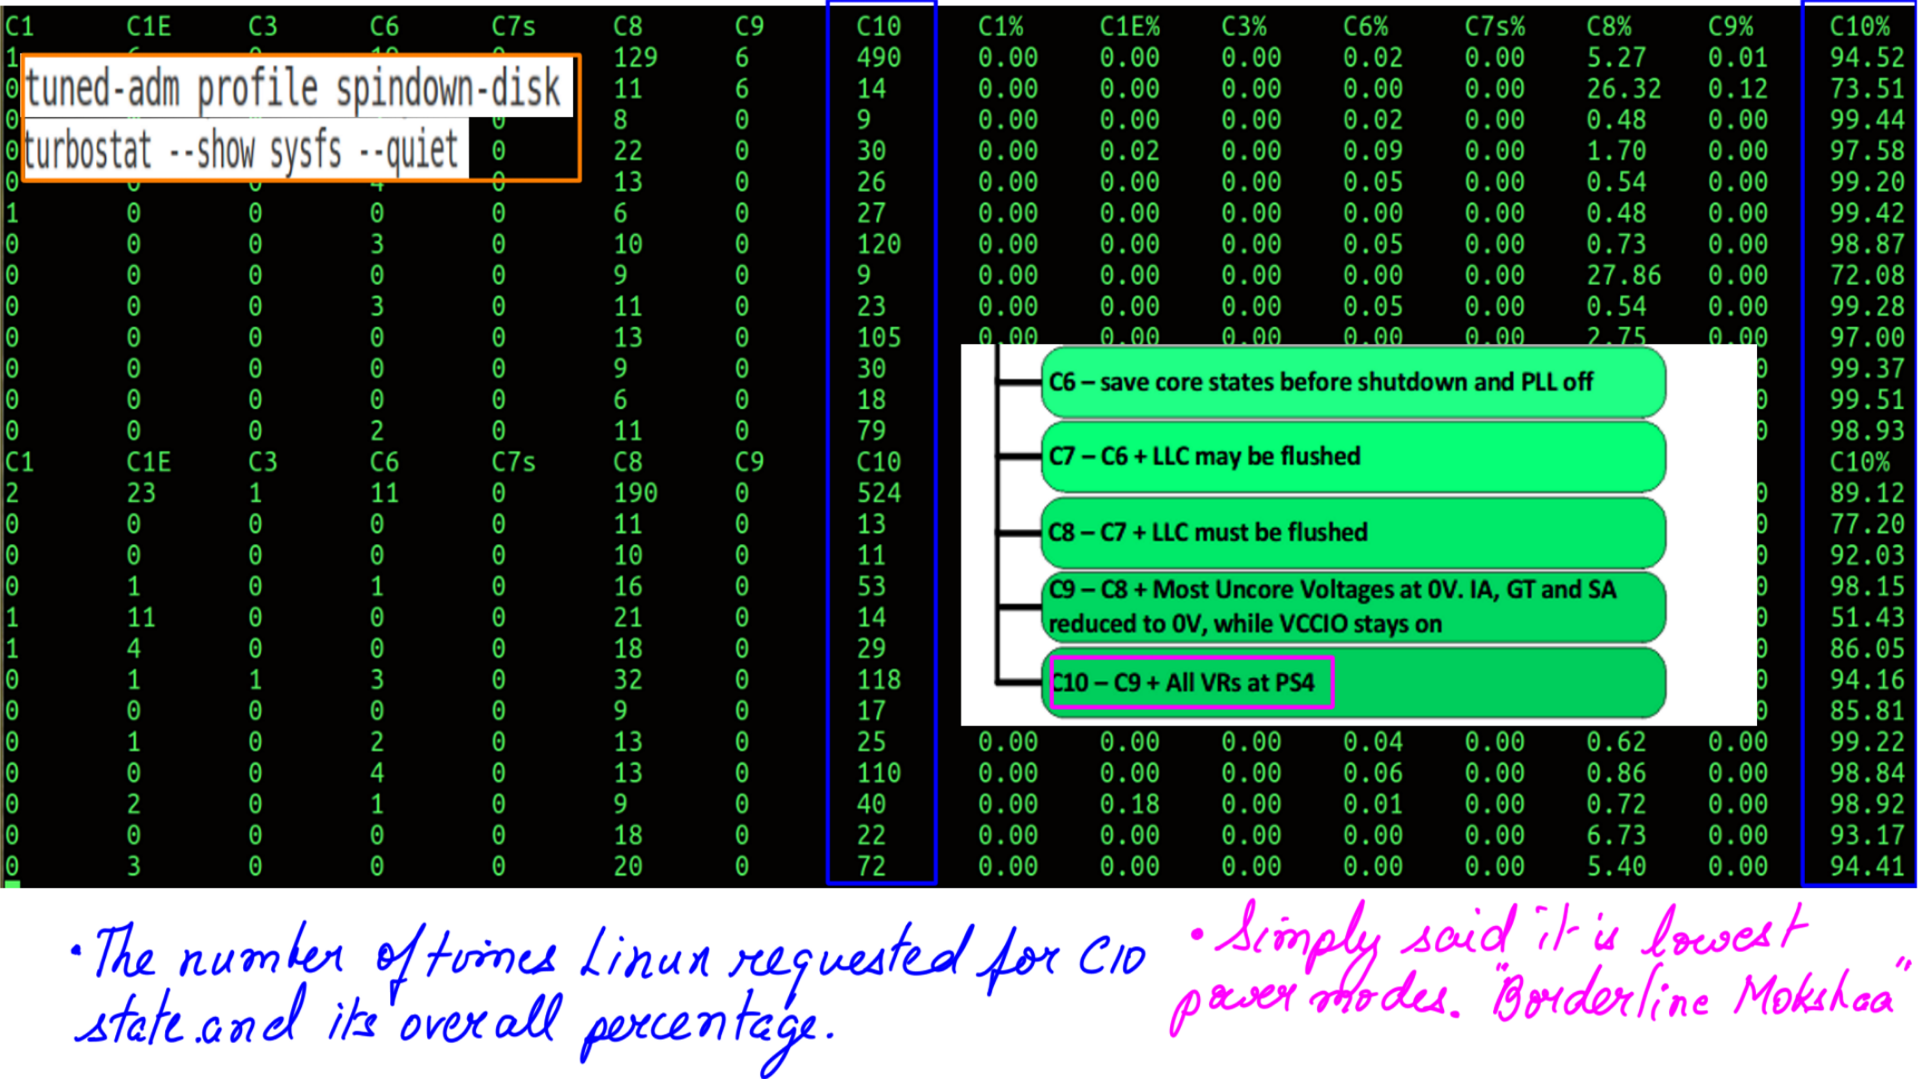
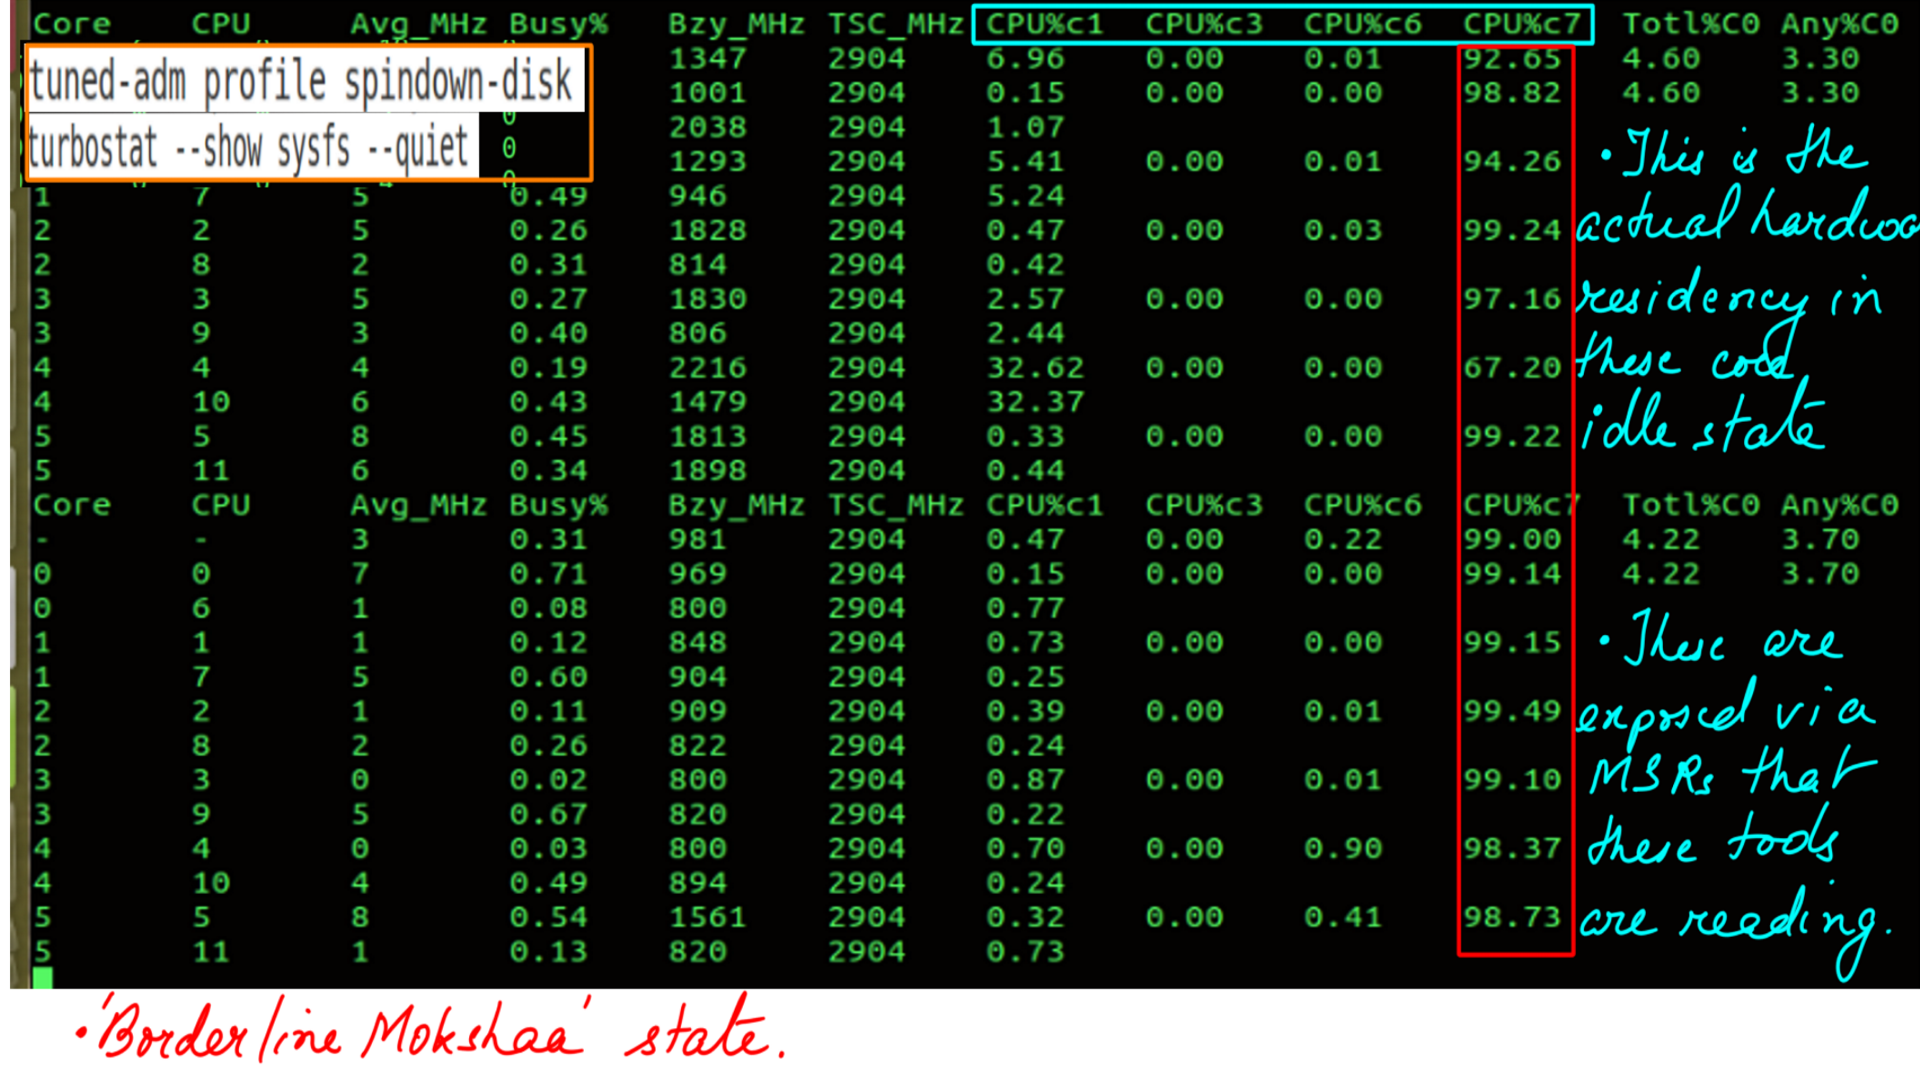
- Active Profile is spindown-disk.
- c-state residency.
- Active Profile is spindown-disk.
- c-state residency.
- c-state residency: C10 has the highest number of requests. It is the lowest powersave mode or borderline Mokshaa..
- Glossary of terms
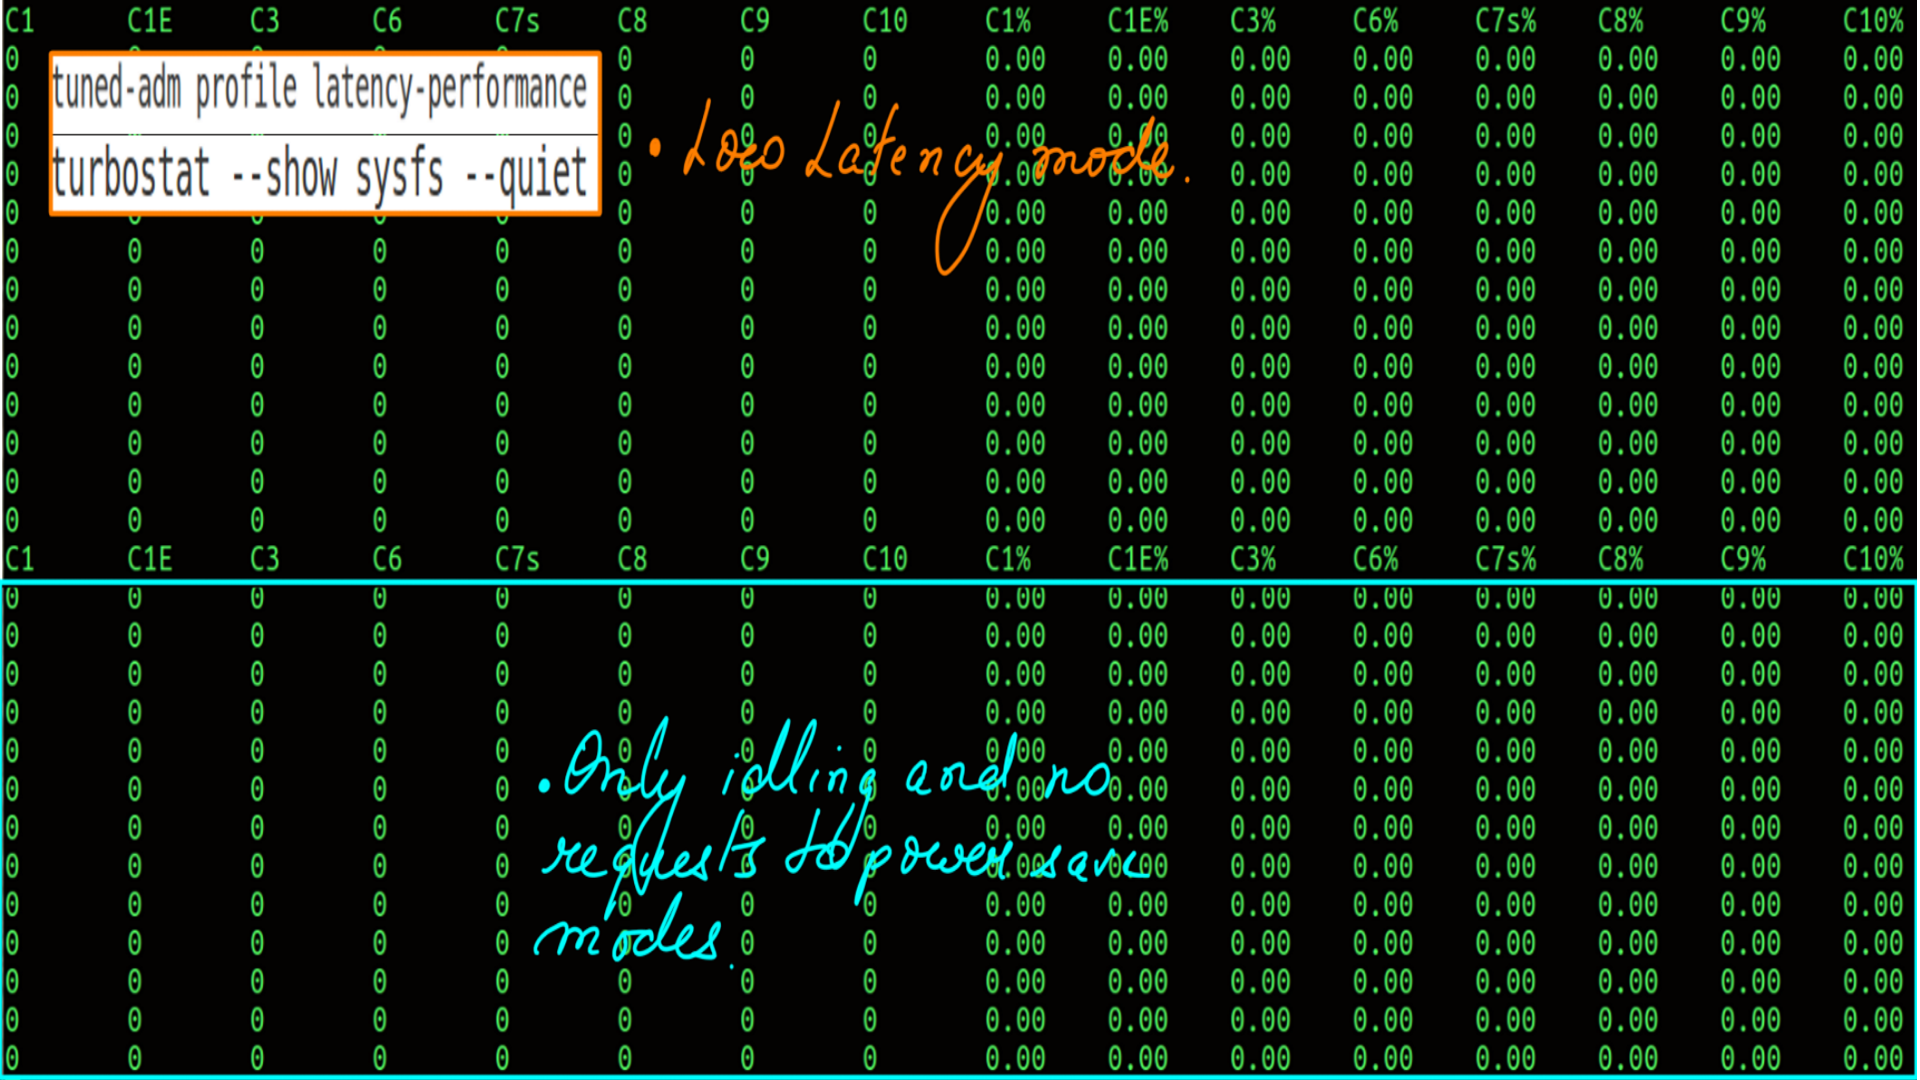
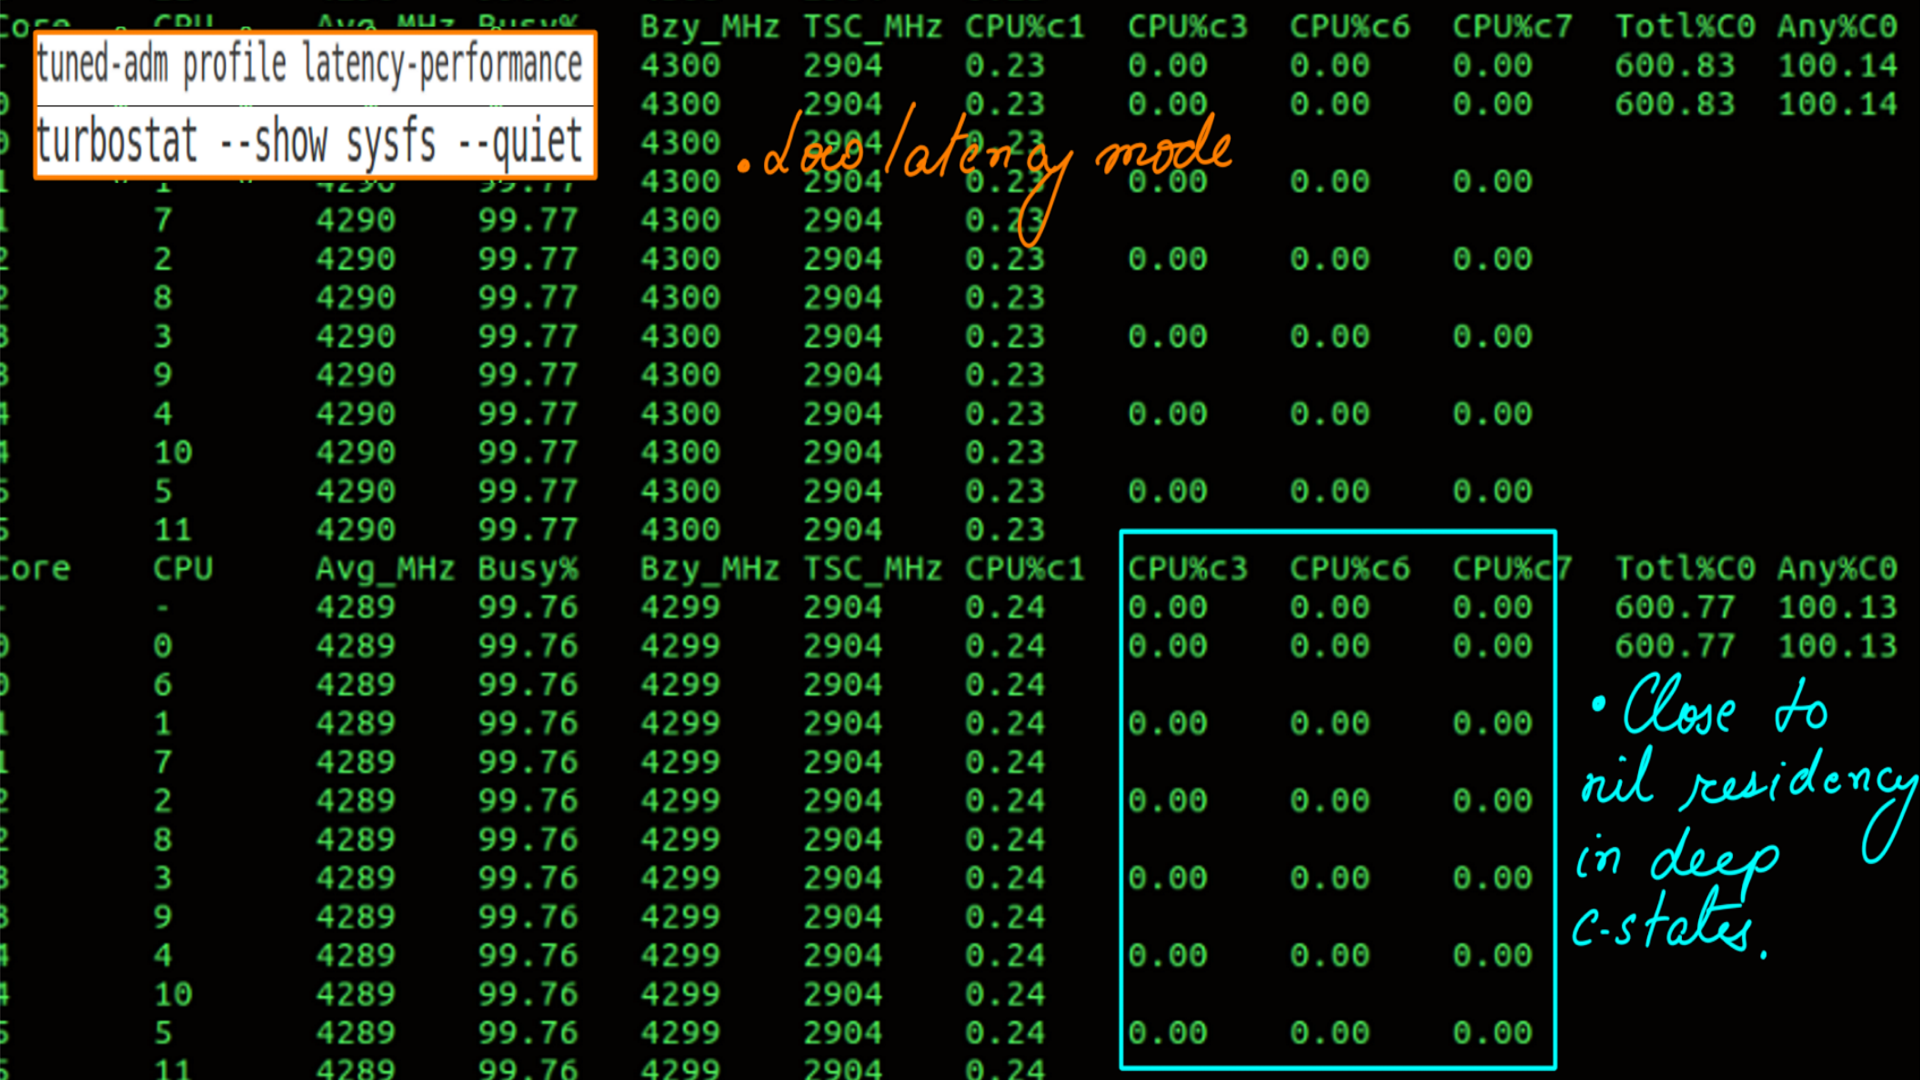
- Active Profile is latency-performance.
- c-state residency.
Power:Tuned:Hardware State Residency
The hardware c-state are requests made by the operating system on behalf of software control policies. However, not all of them may be granted by hardware. Part of the reason for this is 2 logical processors ( Hyper Threads on the same physical core ) may not agree upon the c-states requested. The lower(C1 for e.g.) of the 2 c-state may be granted and the higher one(C6) would report as not granted. The core after all is the same unit. And unlike quantum physics, there is no duality here.
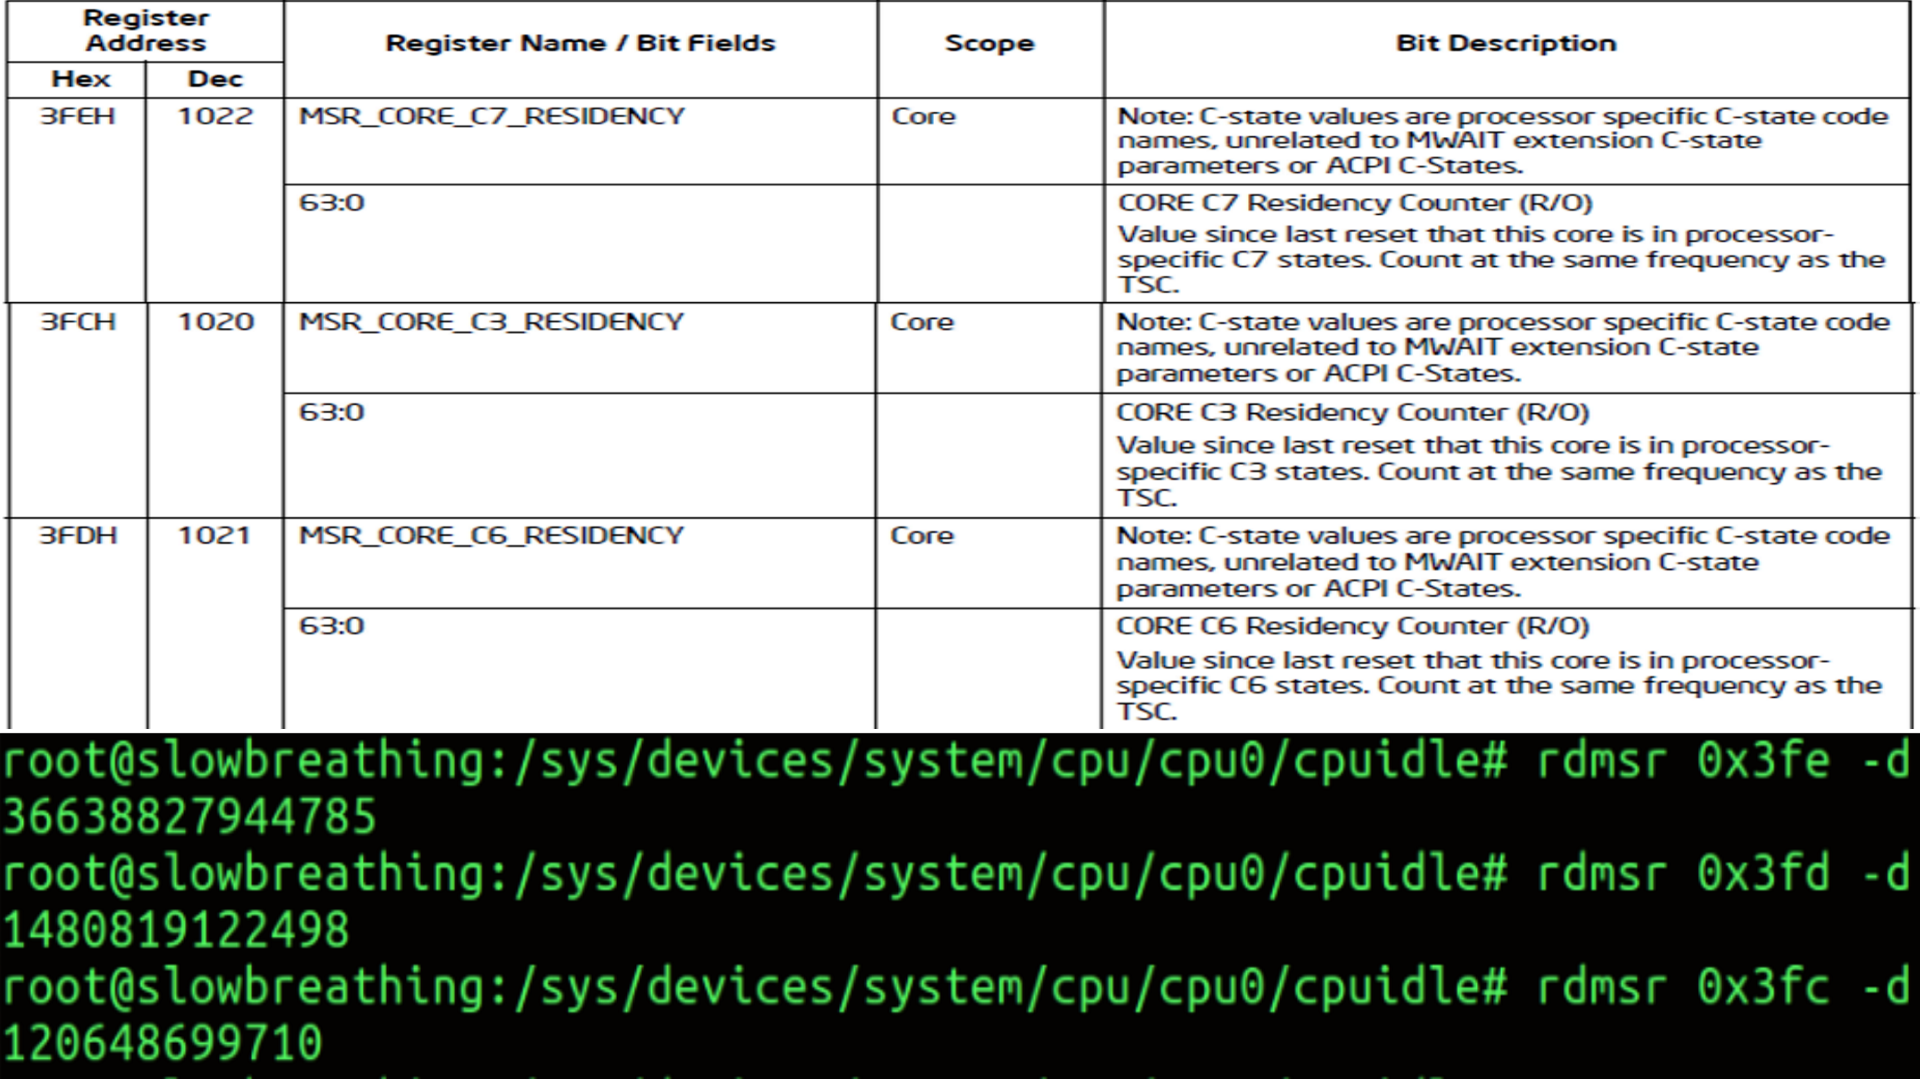
The important thing is how do we measure hardware state residency. Well, there are MSRs (model-specific registers ) on the CPU that can be queried for this.
- MSRs (model-specific registers ) introduced in Sandy Bridge carried through to later microarchitecture pipelines.
- Some register for measuring these values may change..
- Intel’s documentation is the authentic source here. But, it is incredibly difficult to read. It is as if Intel’s employees were given a raise to make it “impossible to comprehend” kind of document.
- Prior to Cannonlake there was no MSR to measure C1 and had to be measure via softawre means. Post Cannonlake it can be measured 0x660H register.
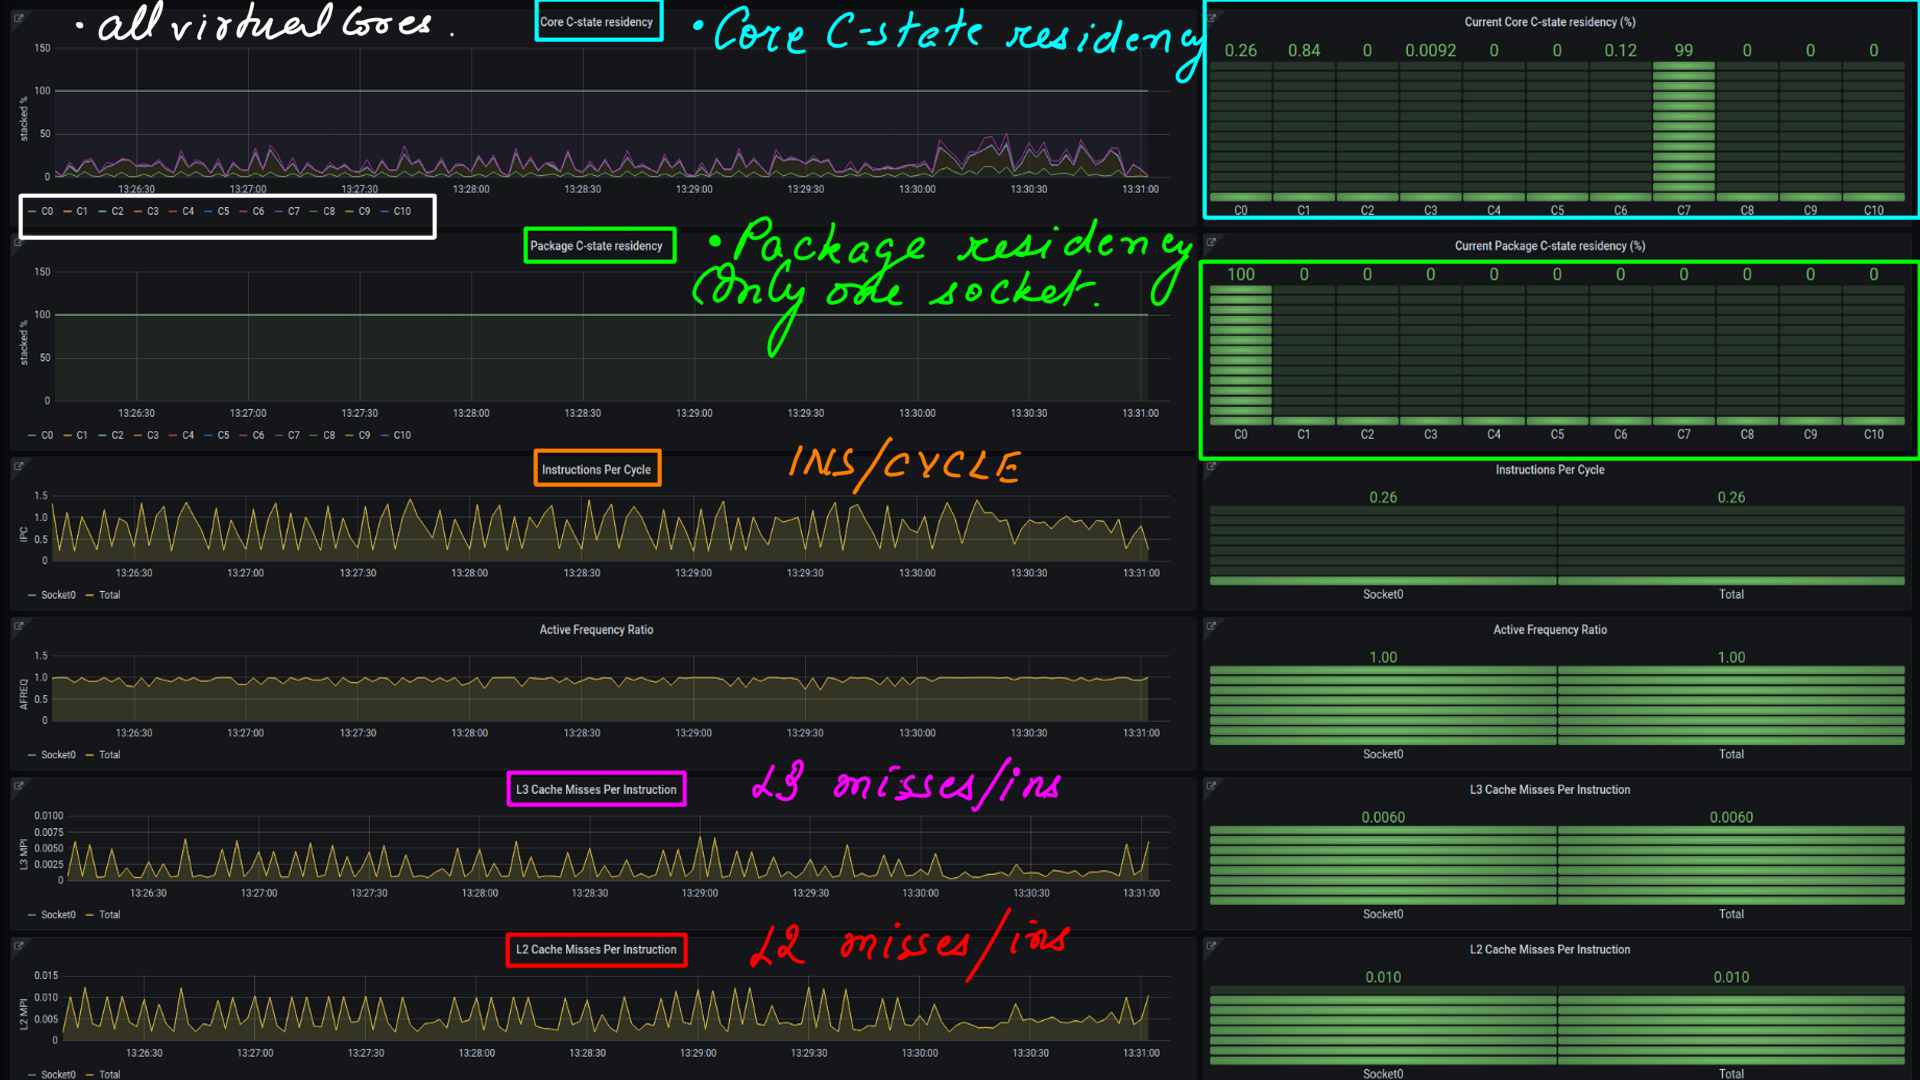
- Active Profile is spindown-disk.
- Hardware State Residency.
- Active Profile is latency-performance.
- Hardware State Residency.
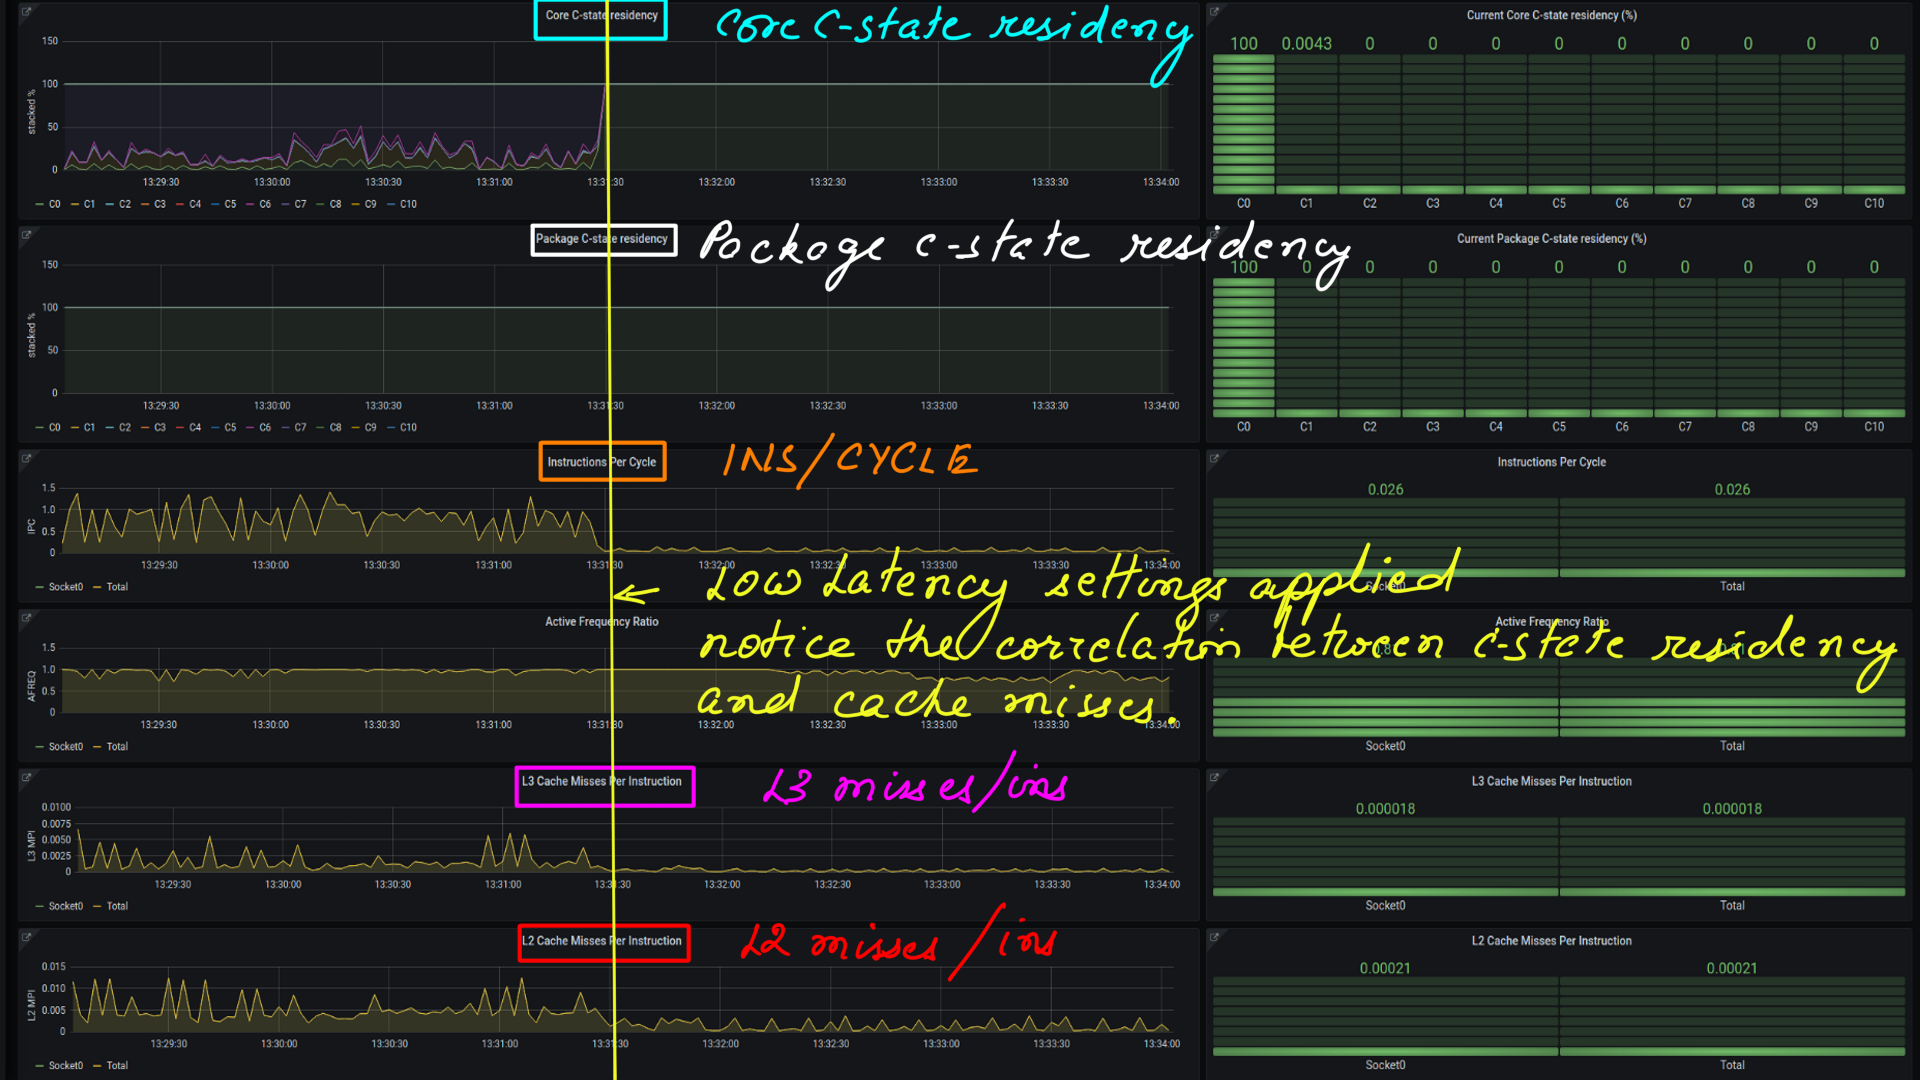
Power:Tuned:Influx:Grafana:c-states
This is visualizing c-states transitions as a time series. We looked at this in the CPUIDLE subsystem:Gathering and undertanding latency data section. The processed CSV files are then moved to influxdb and visualized with grafana.
- Tuned Low latency setting applied midway through the 30 second ftrace recording.
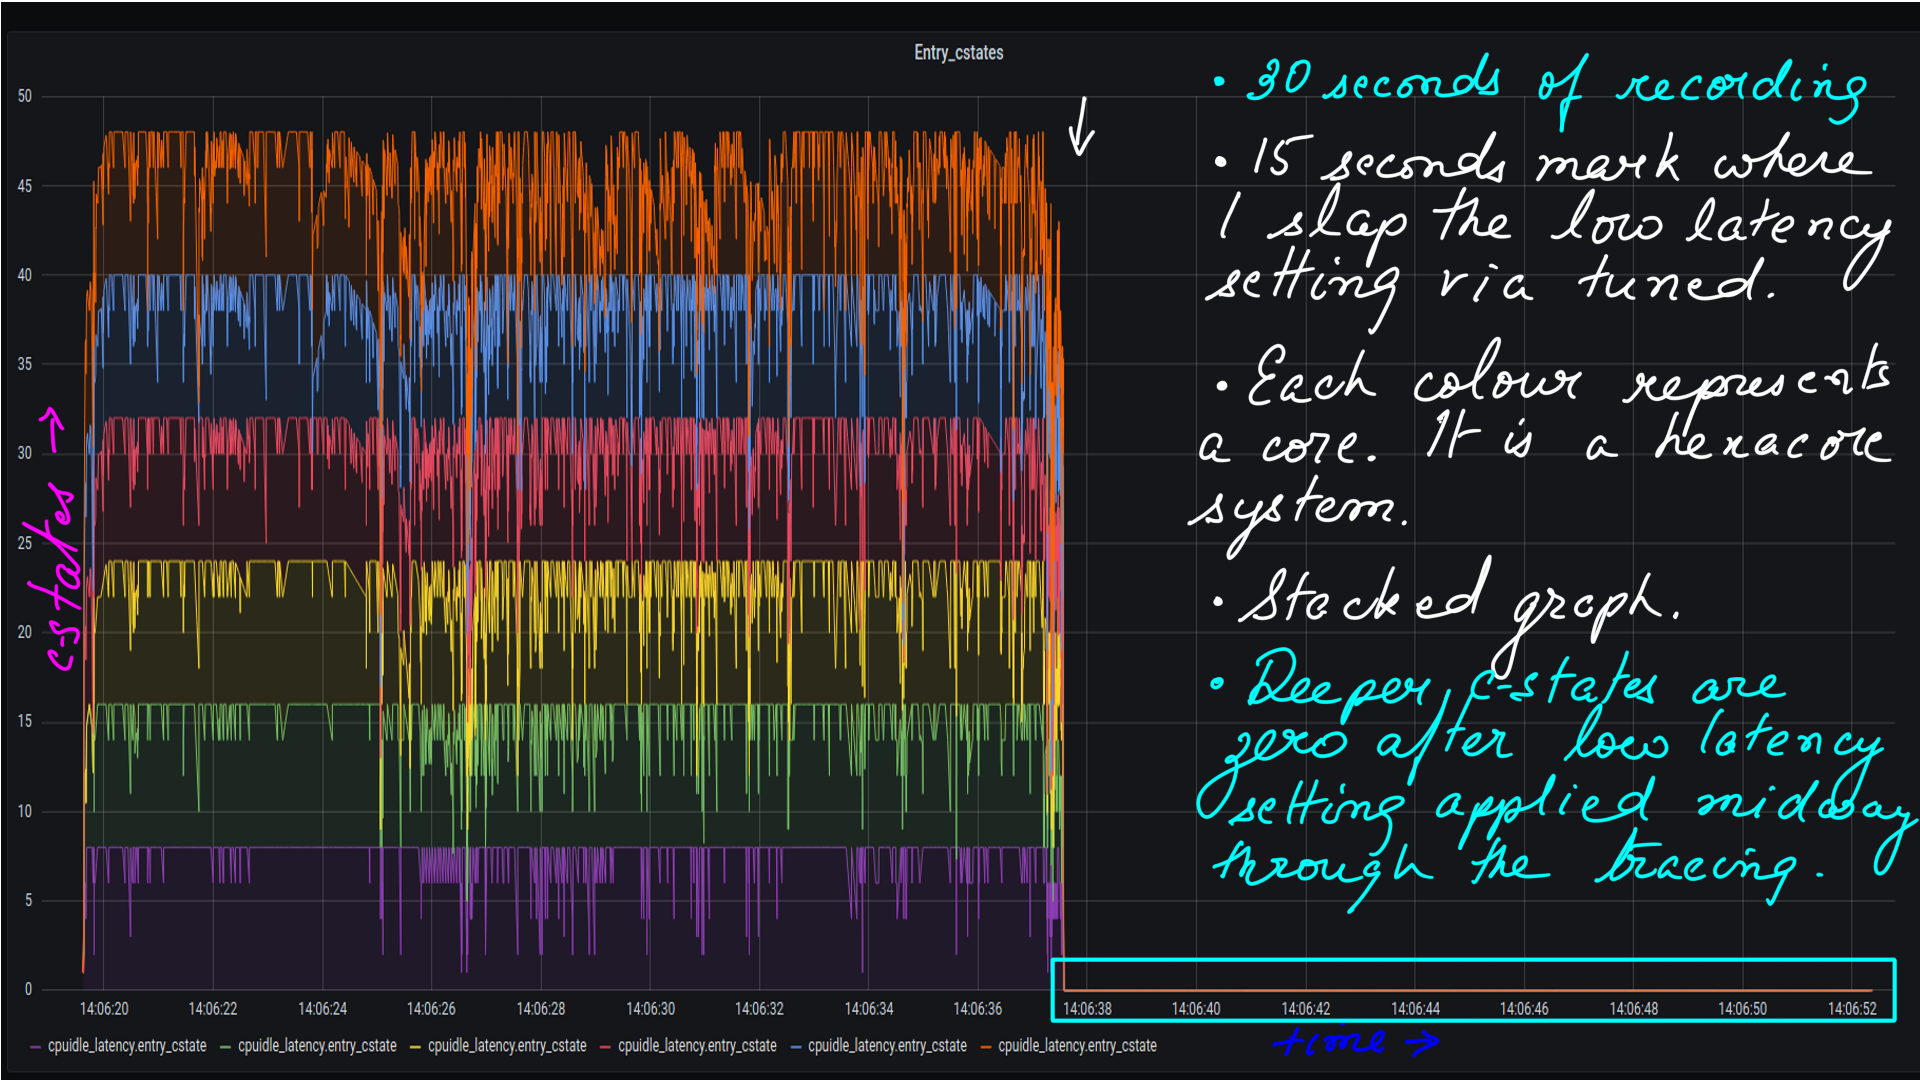
- This is a recording with PCM from Intel now open-sourced..
- It has many dashboards showing various metrics. I am showing a couple of relevant ones like c-state Hardware Residency and L2/L3 Misses.
- These experiments have been done on my laptop with coffeelake client.(I have not been going to office because of covid19. The point is, that the difference is more stark on Xeon CPUs).
- With Low latency setting applied..

Power:Tuned:Measuring Latency
Measuring latency is relatively easy. Just so that we are on the same page. Latency is the elapsed time between when an event should occur and it actually occurs. What is relatively more difficult is apportioning it to a subsystem. In modern computer systems, how or what do we apportion the measured latency to? Is it the Hardware, Operating System, or the Application causing it. And yet, there are underrated tools(ftrace) that are exactly for that purpose. But mind you, ftrace is a low-level tool, and post-processing of data may be required.
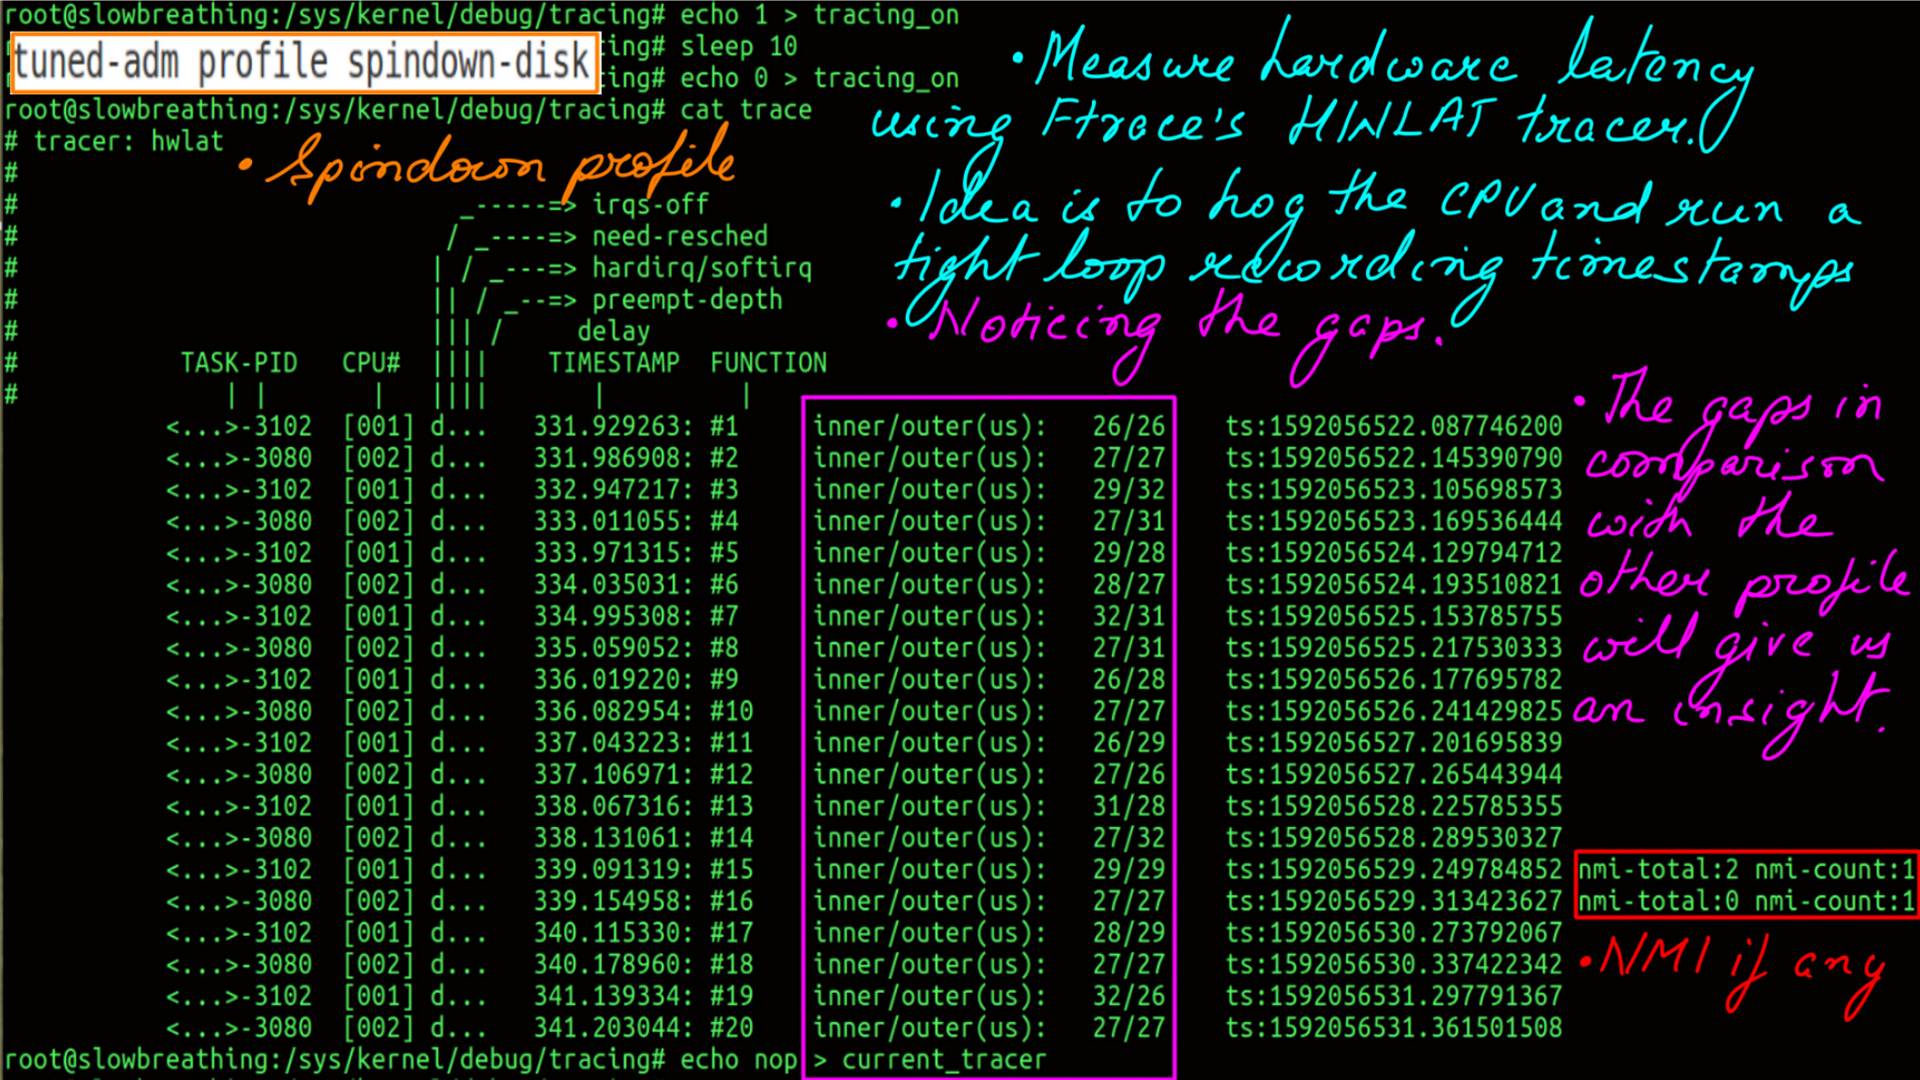
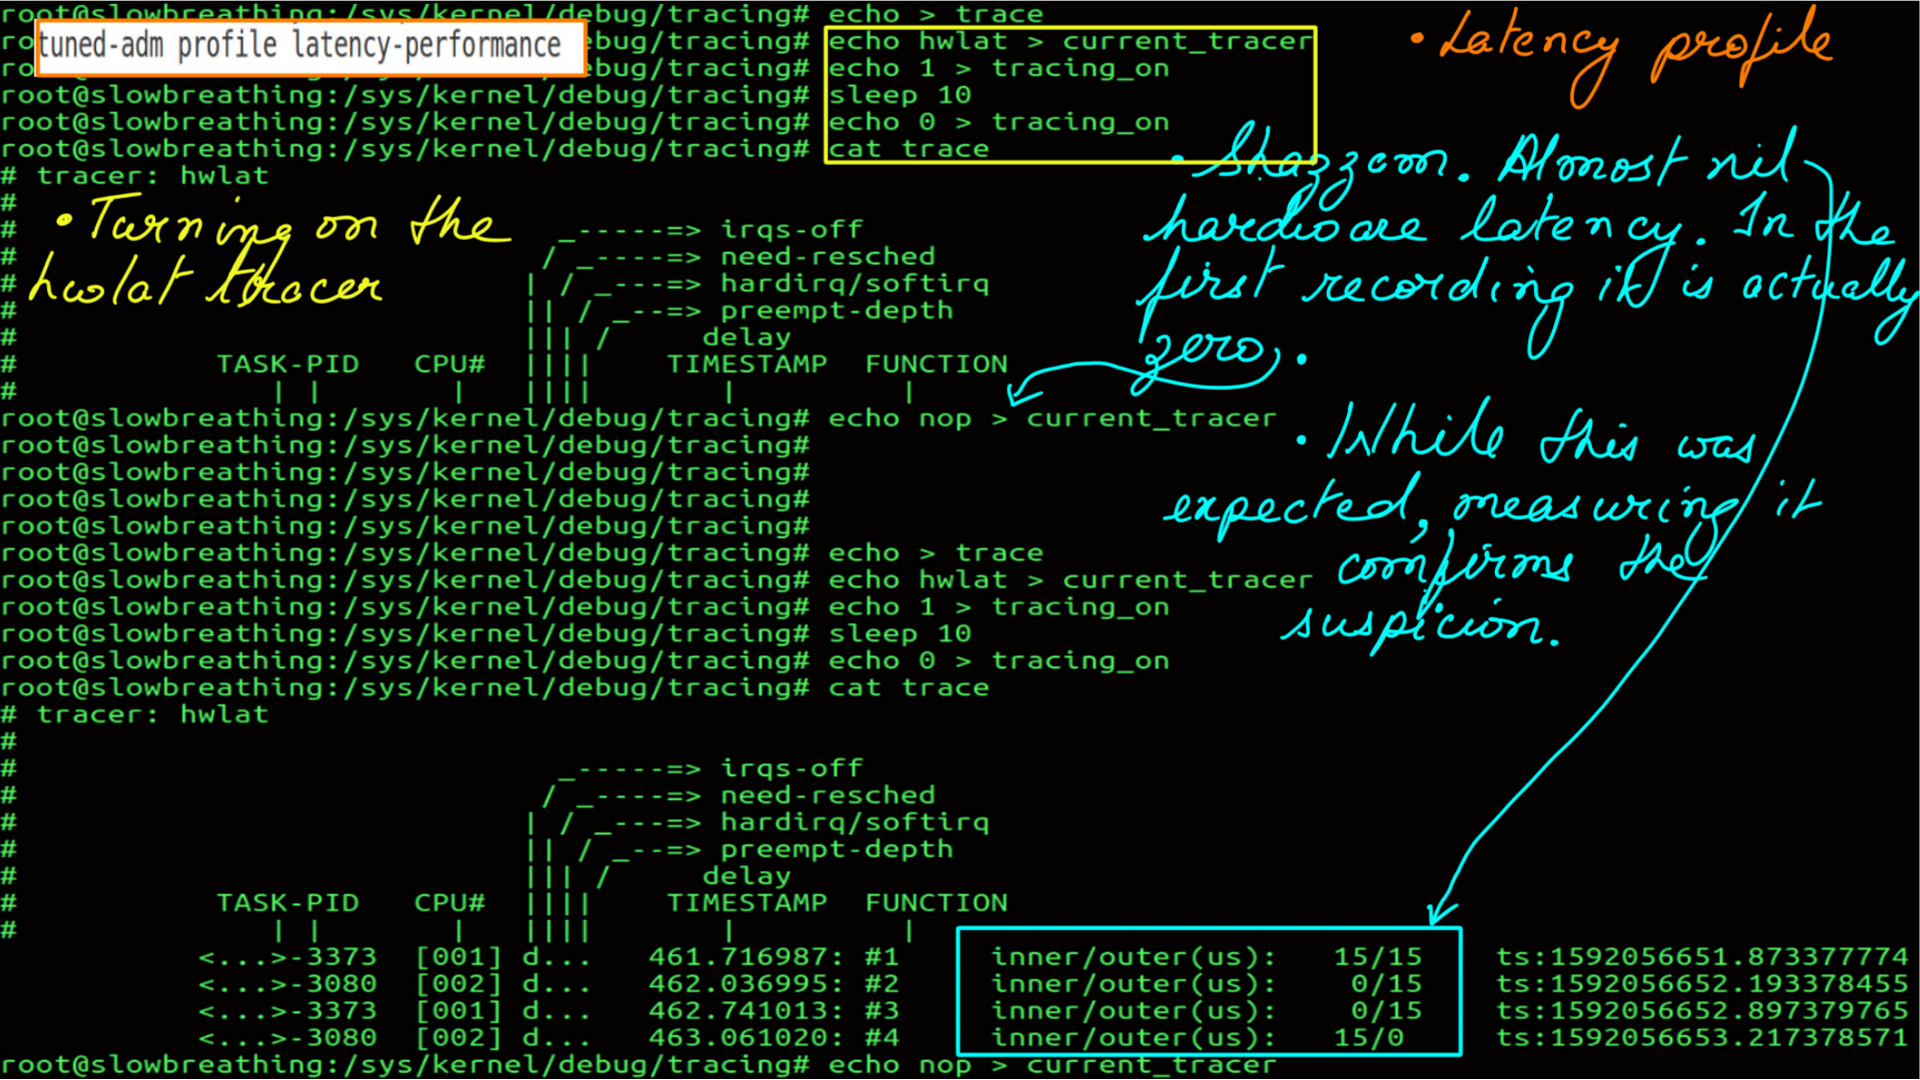
Power:Tuned:Hardware Latency
This is ftrace’s hwlat tracer from the ftrace collection of tracers. What is does is simple yet elegant. It hogs a CPU in a busy loop taking timestamps for a configured amount of time. It does so with interrupts disabled. It then reports the gaps in the timestamp. Not all code paths are covered obviously but give us a fair idea of hardware latency.
- Active Profile is spindown-disk.
- Hardware Latency of the system.
- Active Profile is latency-performance.
- Hardware Latency of the system.
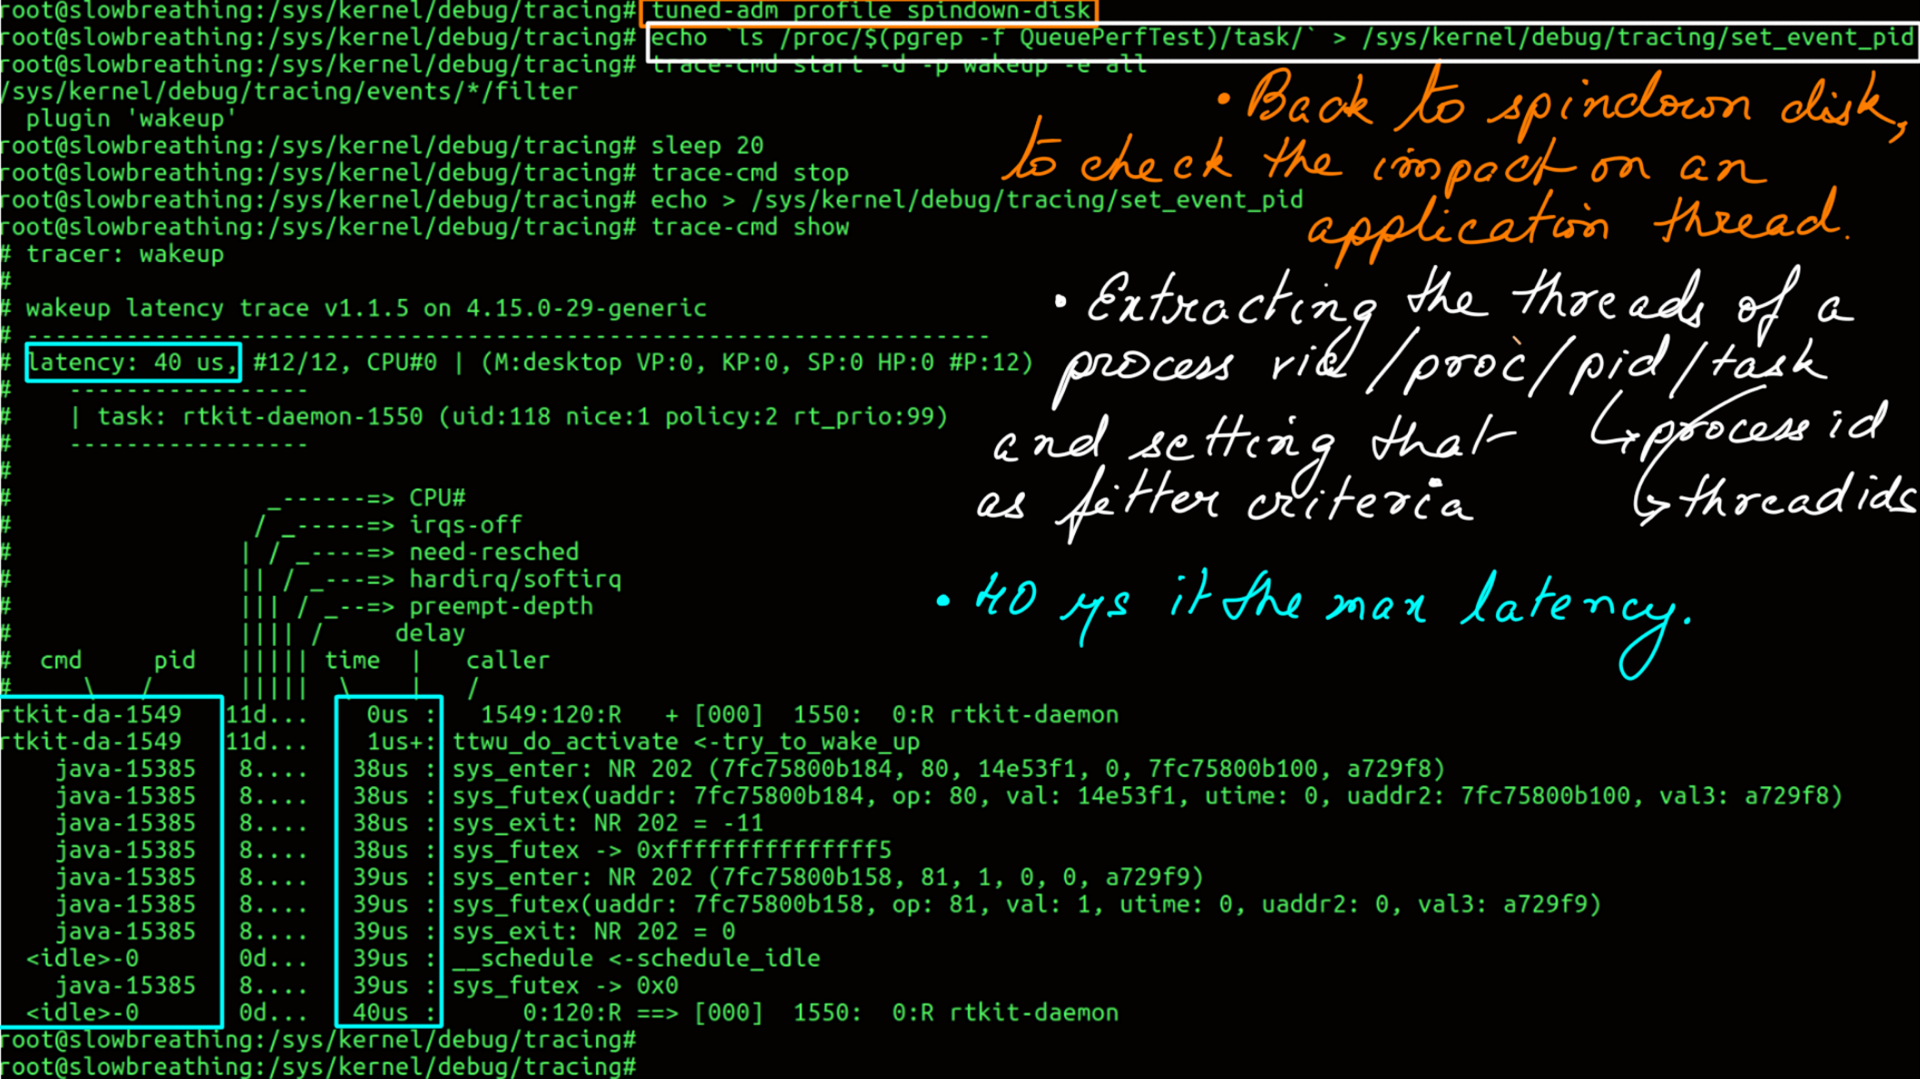
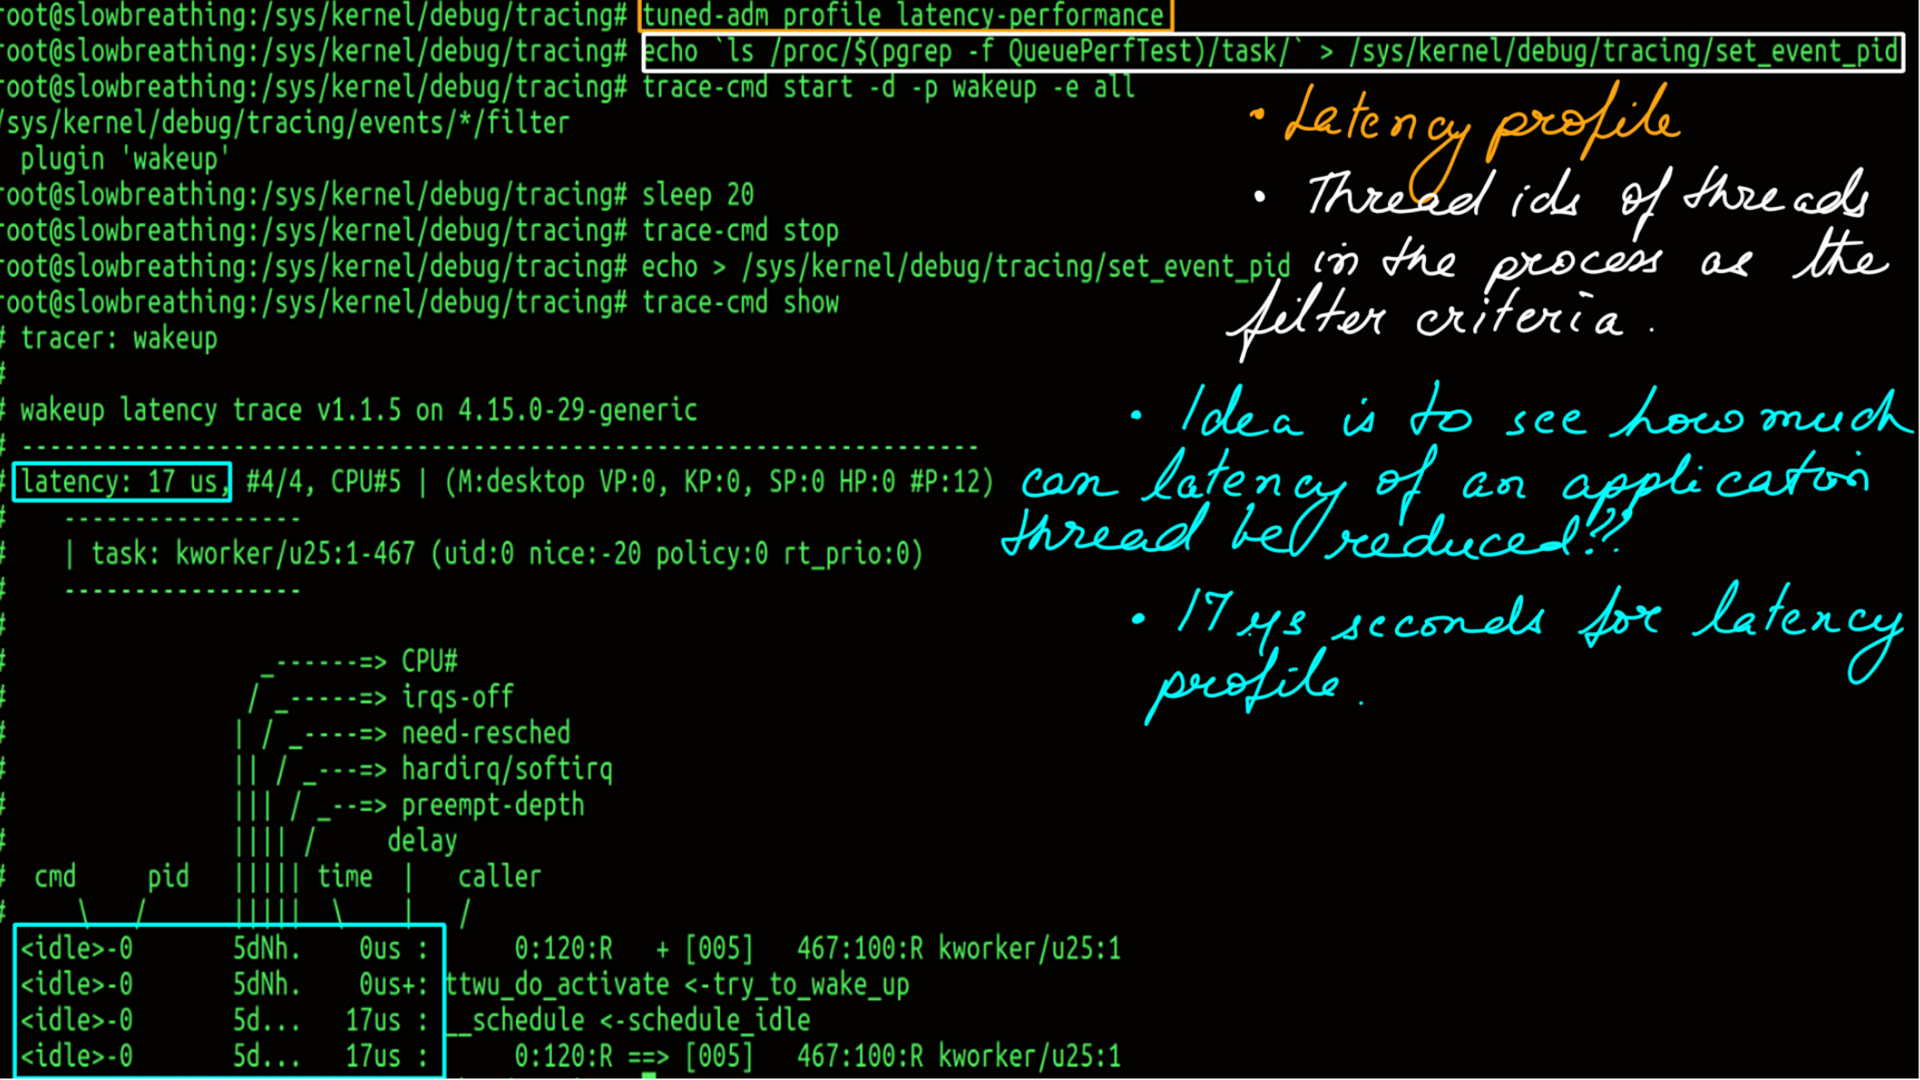
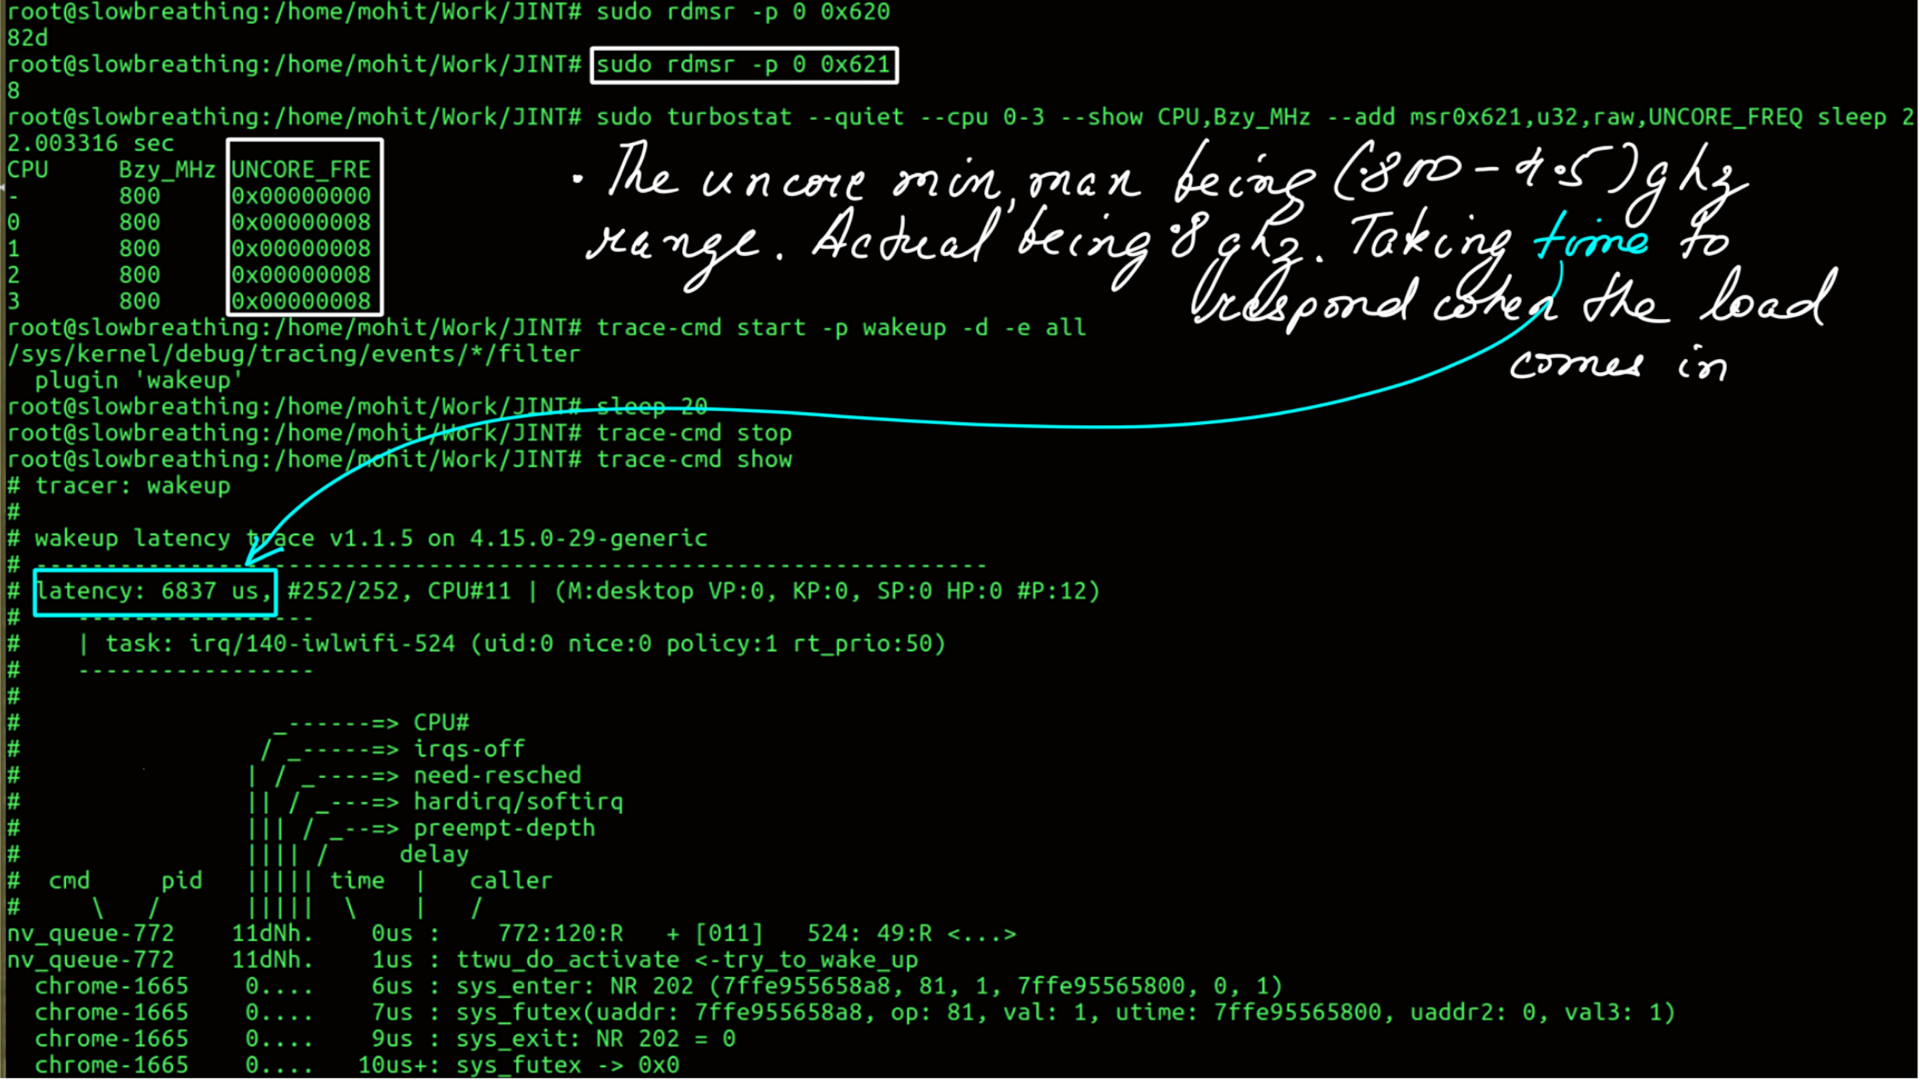
Power:Tuned:Wakeup Latency
Wakeup tracer from ftrace traces the elapsed time from a task being woken up to actually waking up. There are too many variables here, for e.g. other tasks in the queue. In order for this to make sense, one has to look at this relatively and pick the latency numbers for the same task.
- Active Profile is spindown-disk.
- Wakeup Latency of the system.
- Notice the latency of “__schedule”, you can interpret that as the latency of the OS scheduler..
- Active Profile is latency-performance.
- Wakeup Latency of the system.
- Notice the latency of “__schedule”, you can interpret that as the latency of the OS scheduler..
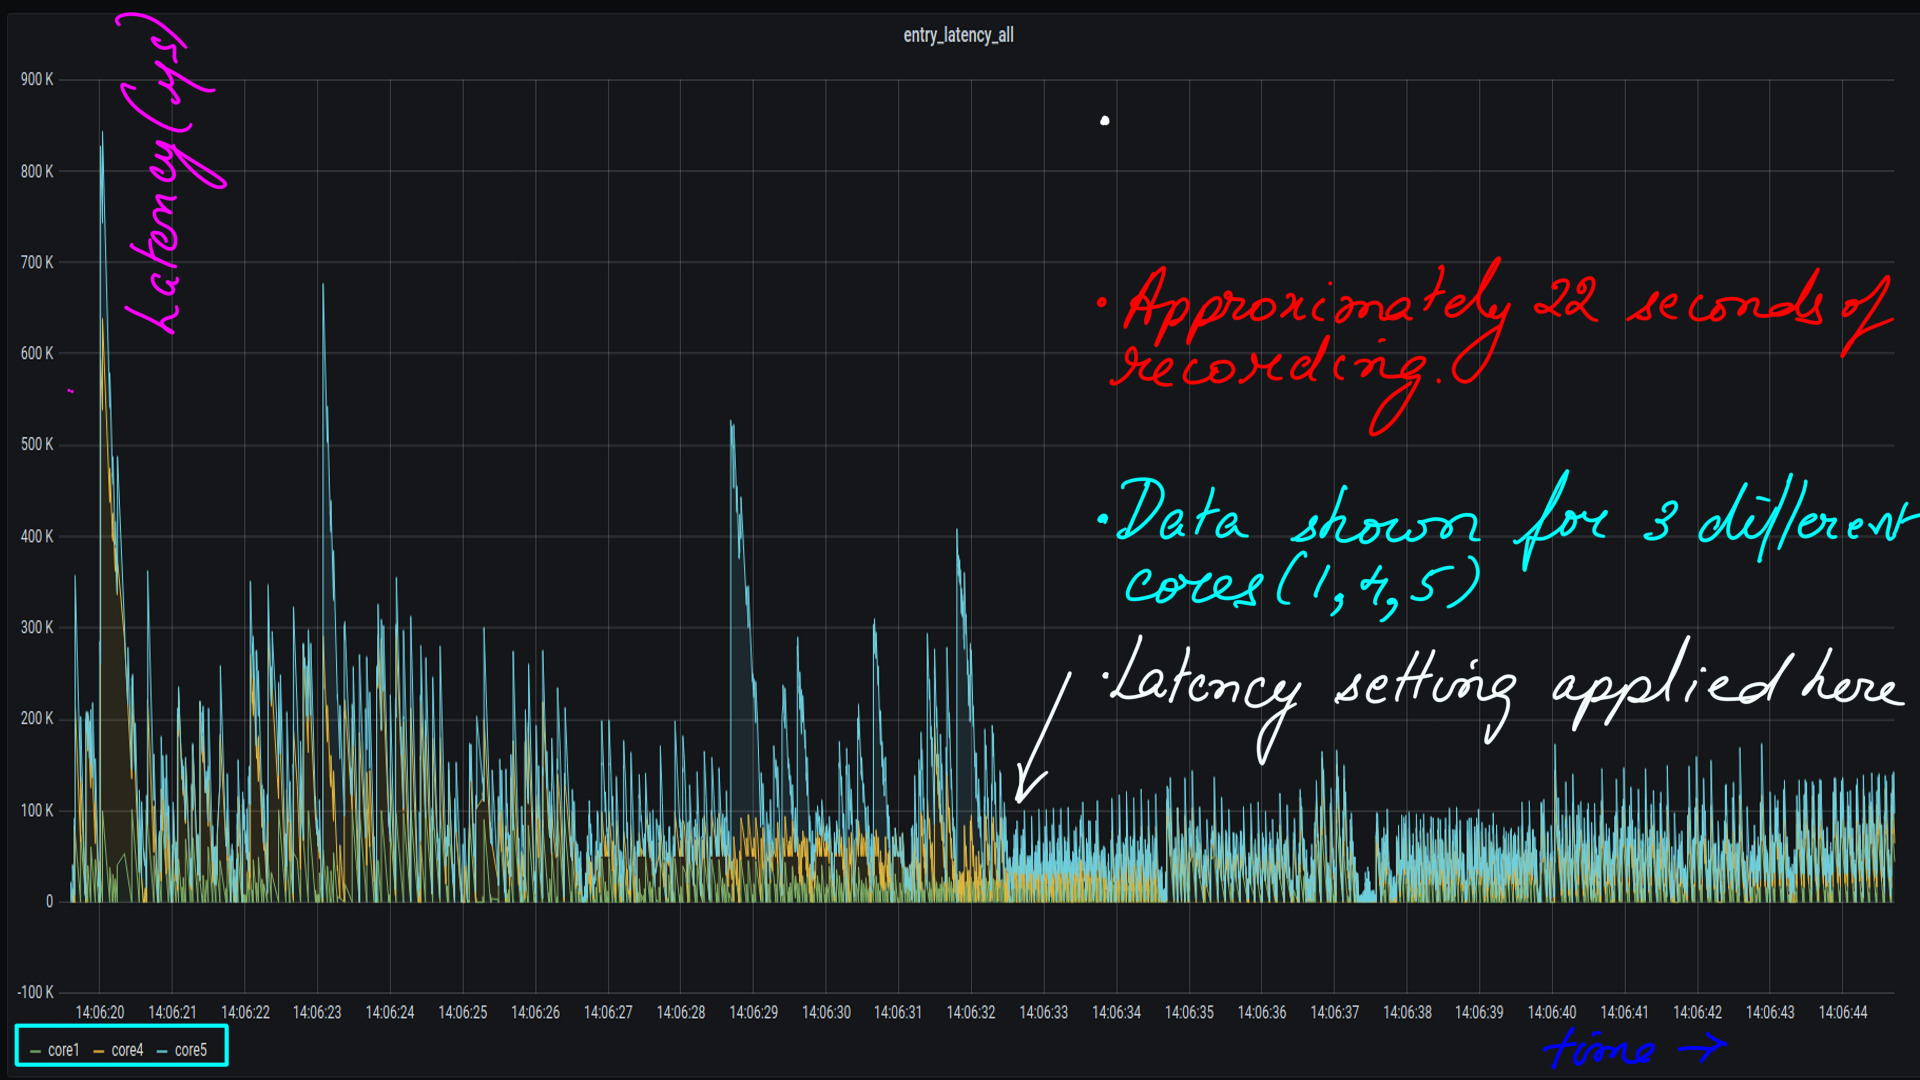
Power:Tuned:Influx:Grafana:latency
This is visualizing latency as a time series. We looked at this in the CPUIDLE subsystem:Gathering and undertanding latency data section. The processed CSV files are then moved to influxdb and visualized with grafana.
- Tuned Low latency setting applied midway through the 22 second ftrace recording.
Power:PMQOS
This interface provides a kernel and user mode interface for registering performance expectations by drivers, subsystems, and user space applications on one of the parameters. Two different PM QoS(Power Management Quality of Service) frameworks are available:
- PM QoS classes for cpu_dma_latency, network_latency, network_throughput, memory_bandwidth.
- The per-device PM QoS framework provides the API to manage the per-device latency constraints and PM QoS flags.
Here are the benefits
- Provides flexibility, variety and degree of options
- Uses available tools and infrastructure
- Scalable and can be easily included early in application design
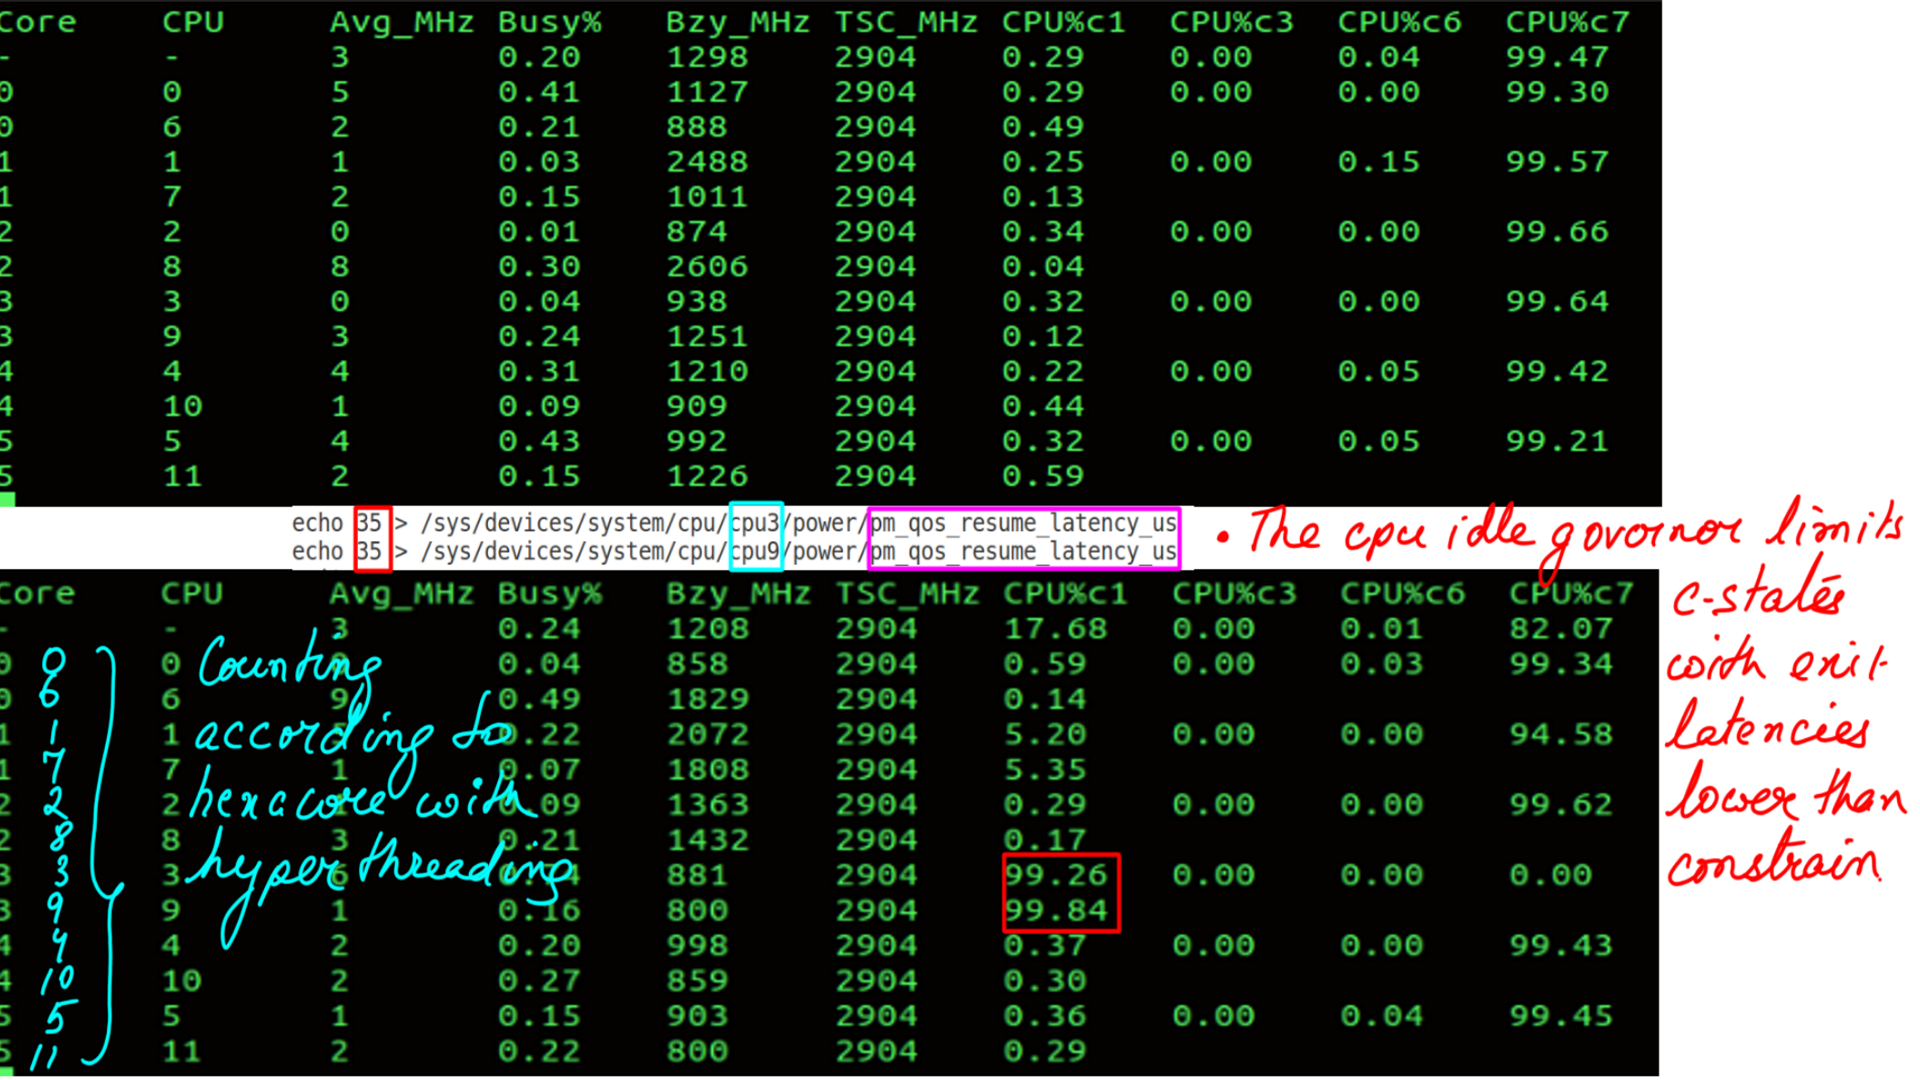
Let me simplify this. Refer back to figure-8 and figure-9. You’ll notice that the settings take effect for all the cores in the system. “pm_qos” is a much more fine-grained interface. Now let’s look at figure-10 below especially virtual cores 3 and 9.
- Hardware-State-Residency with “pm_qos”.
- Notice the latency of “__schedule”, you can interpret that as the latency of the OS scheduler..
- Allows user to specify a resume latency constraint
- CPU idle governor limits C states with exit latencies lower than the constraint
- Application can change constraint at different phases
- C states can be controlled in each core independently
Power:Turn things down
Changing the frequency and voltage of a subset of the system: Traditionally these states have been focused on the cores, but changing the frequencies of other components of the CPU is also possible (such as a shared L3 cache). Execution can continue at varied performance and power levels when using P-states. Voltage/frequency scaling If high frequency is not required, it can be dynamically reduced in order to achieve a lower power level. When frequency is reduced, it may also be possible to reduce the voltage. Voltage/frequency(vret) required to maintain state in a circuit can be lower than the voltage required to operate that circuit.
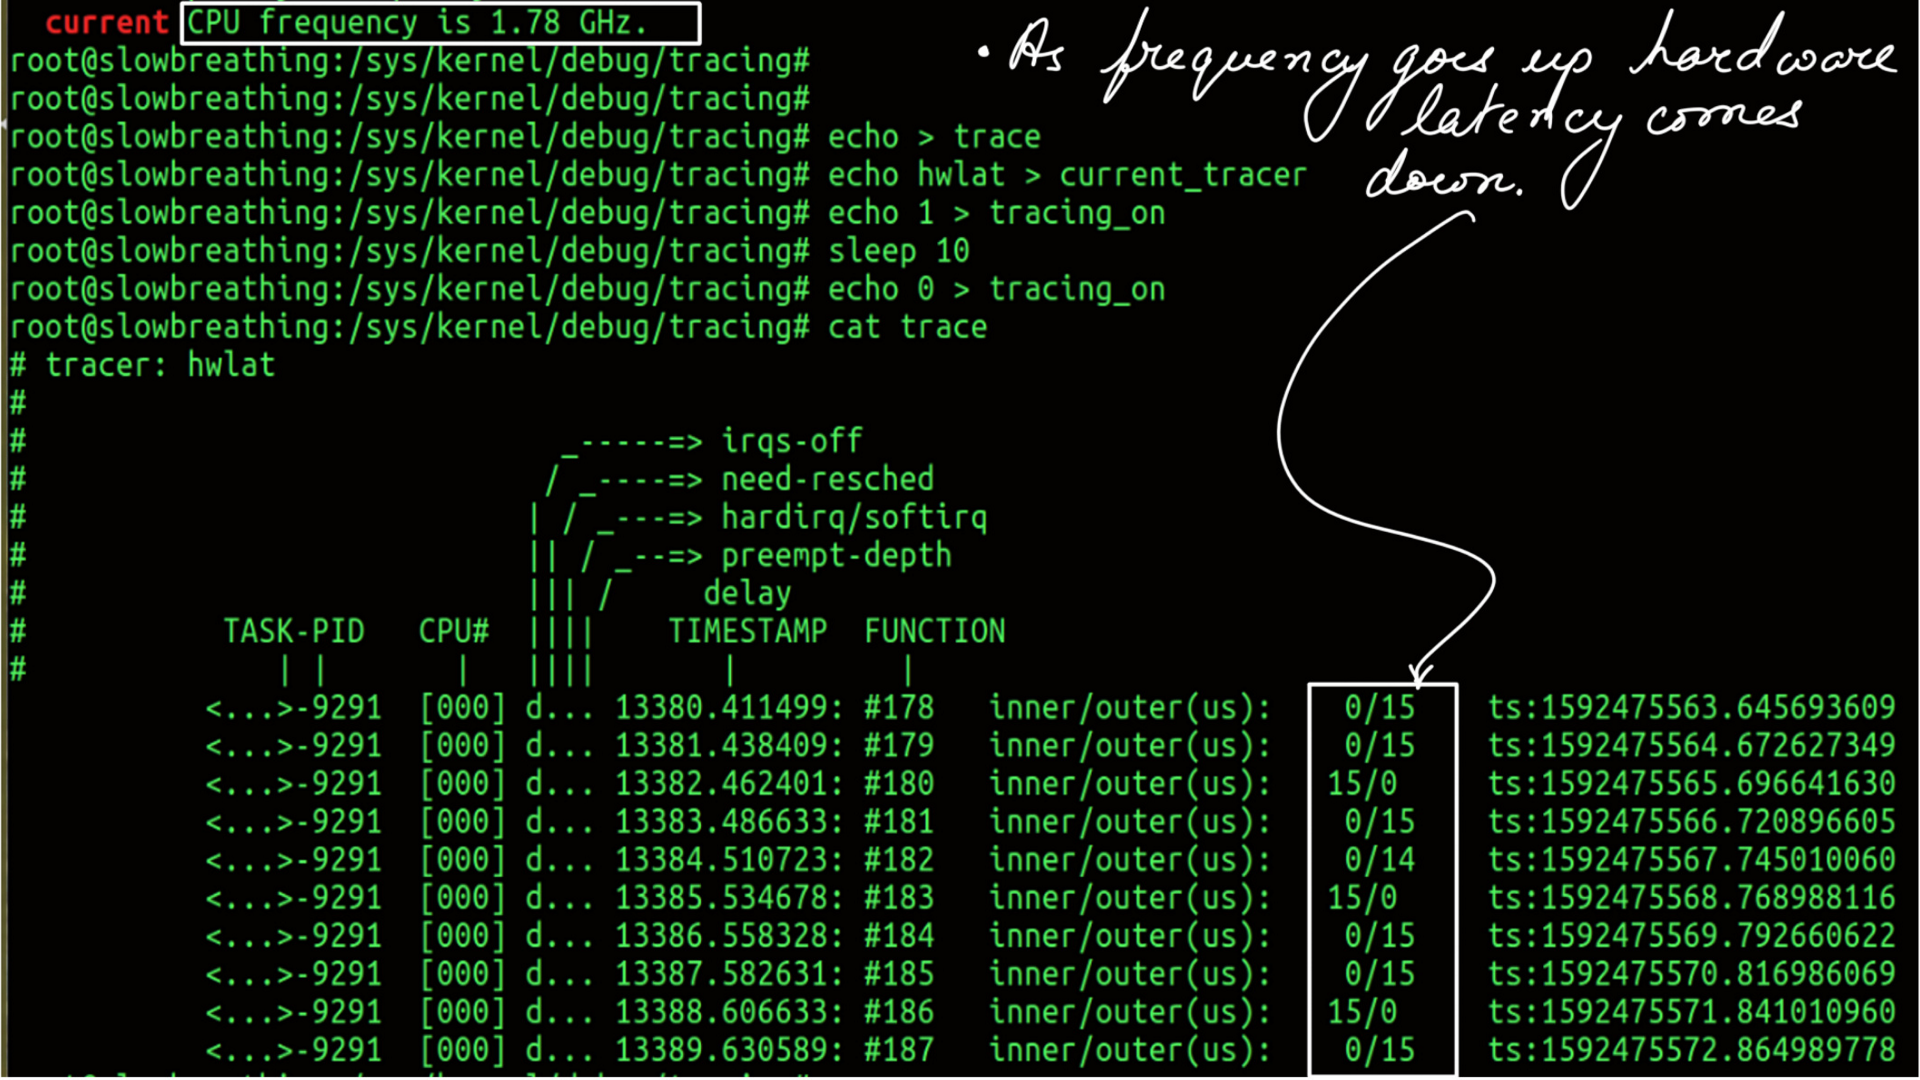
Power:Turn things down:P-states:Hardware Latency
- Frequency can be changed using tools like likwid
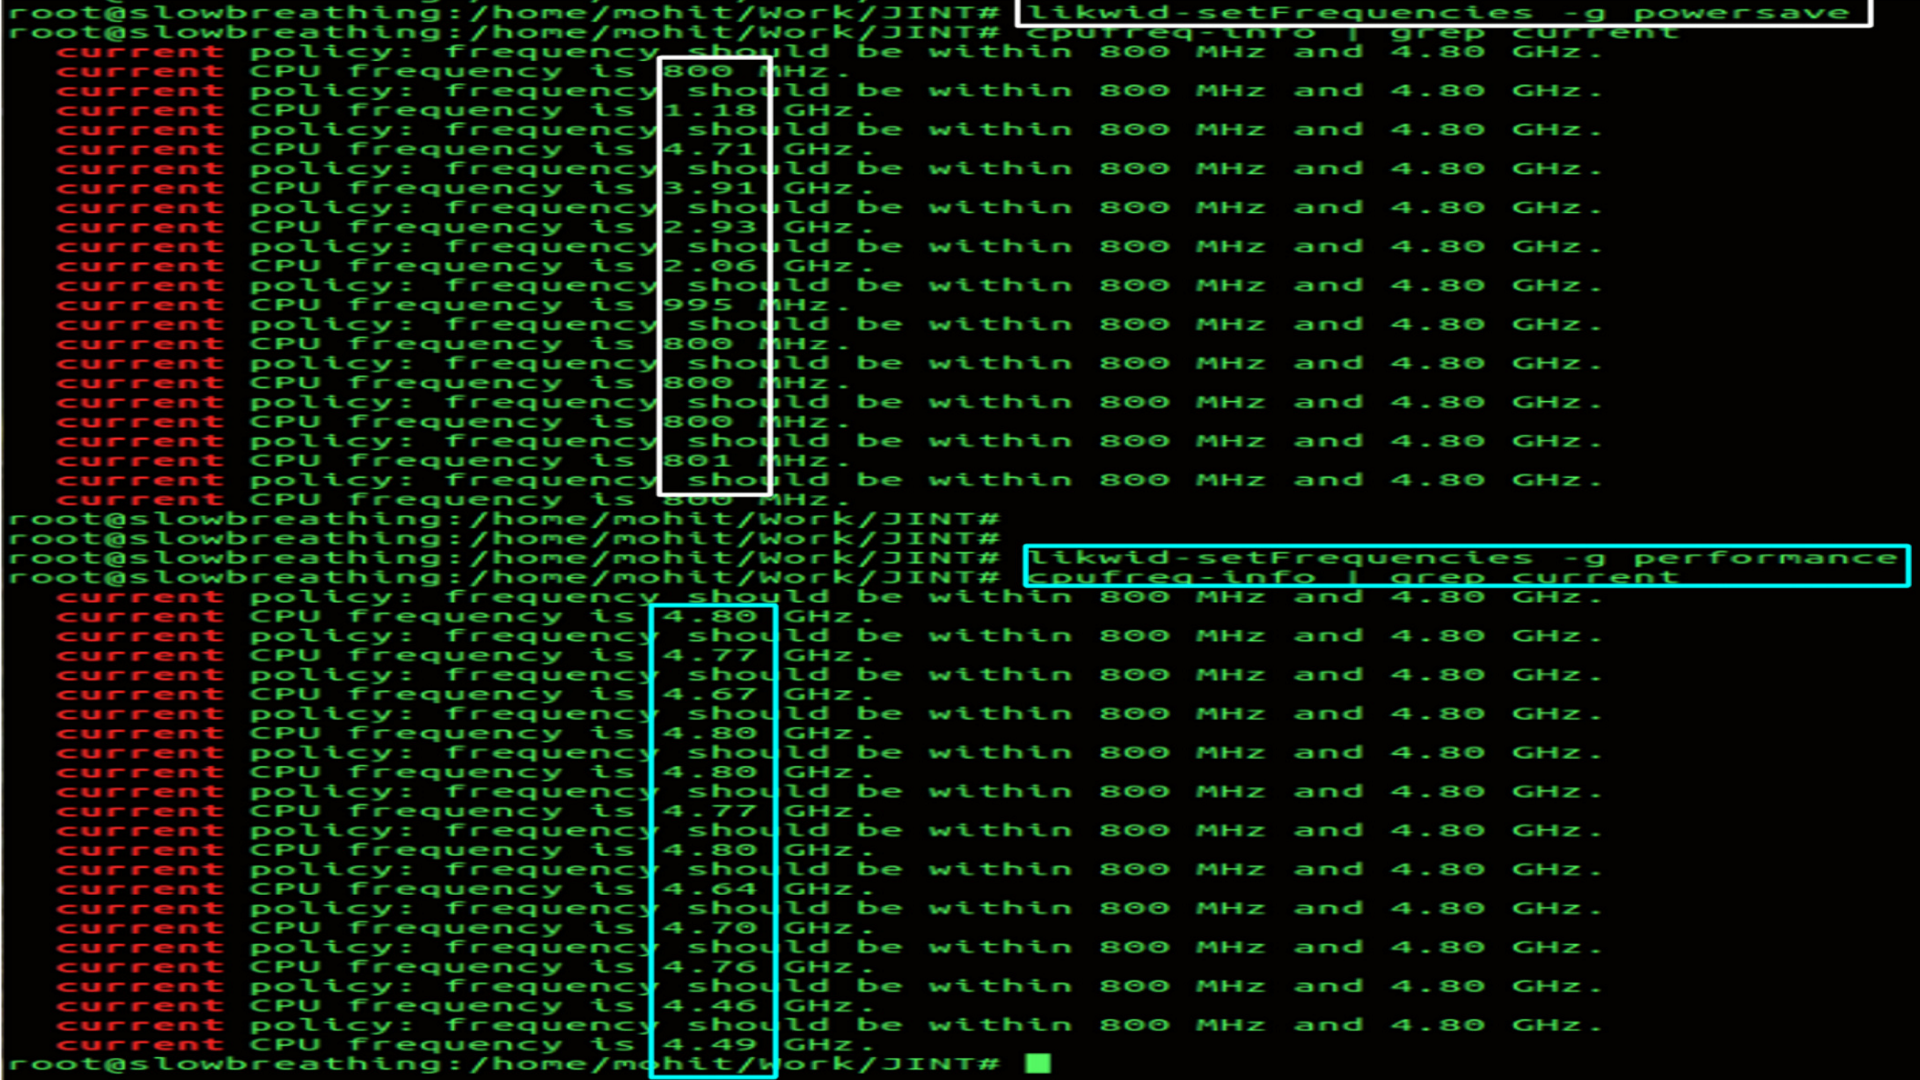
- Low Frequency.
- Hardware Latency of the system.
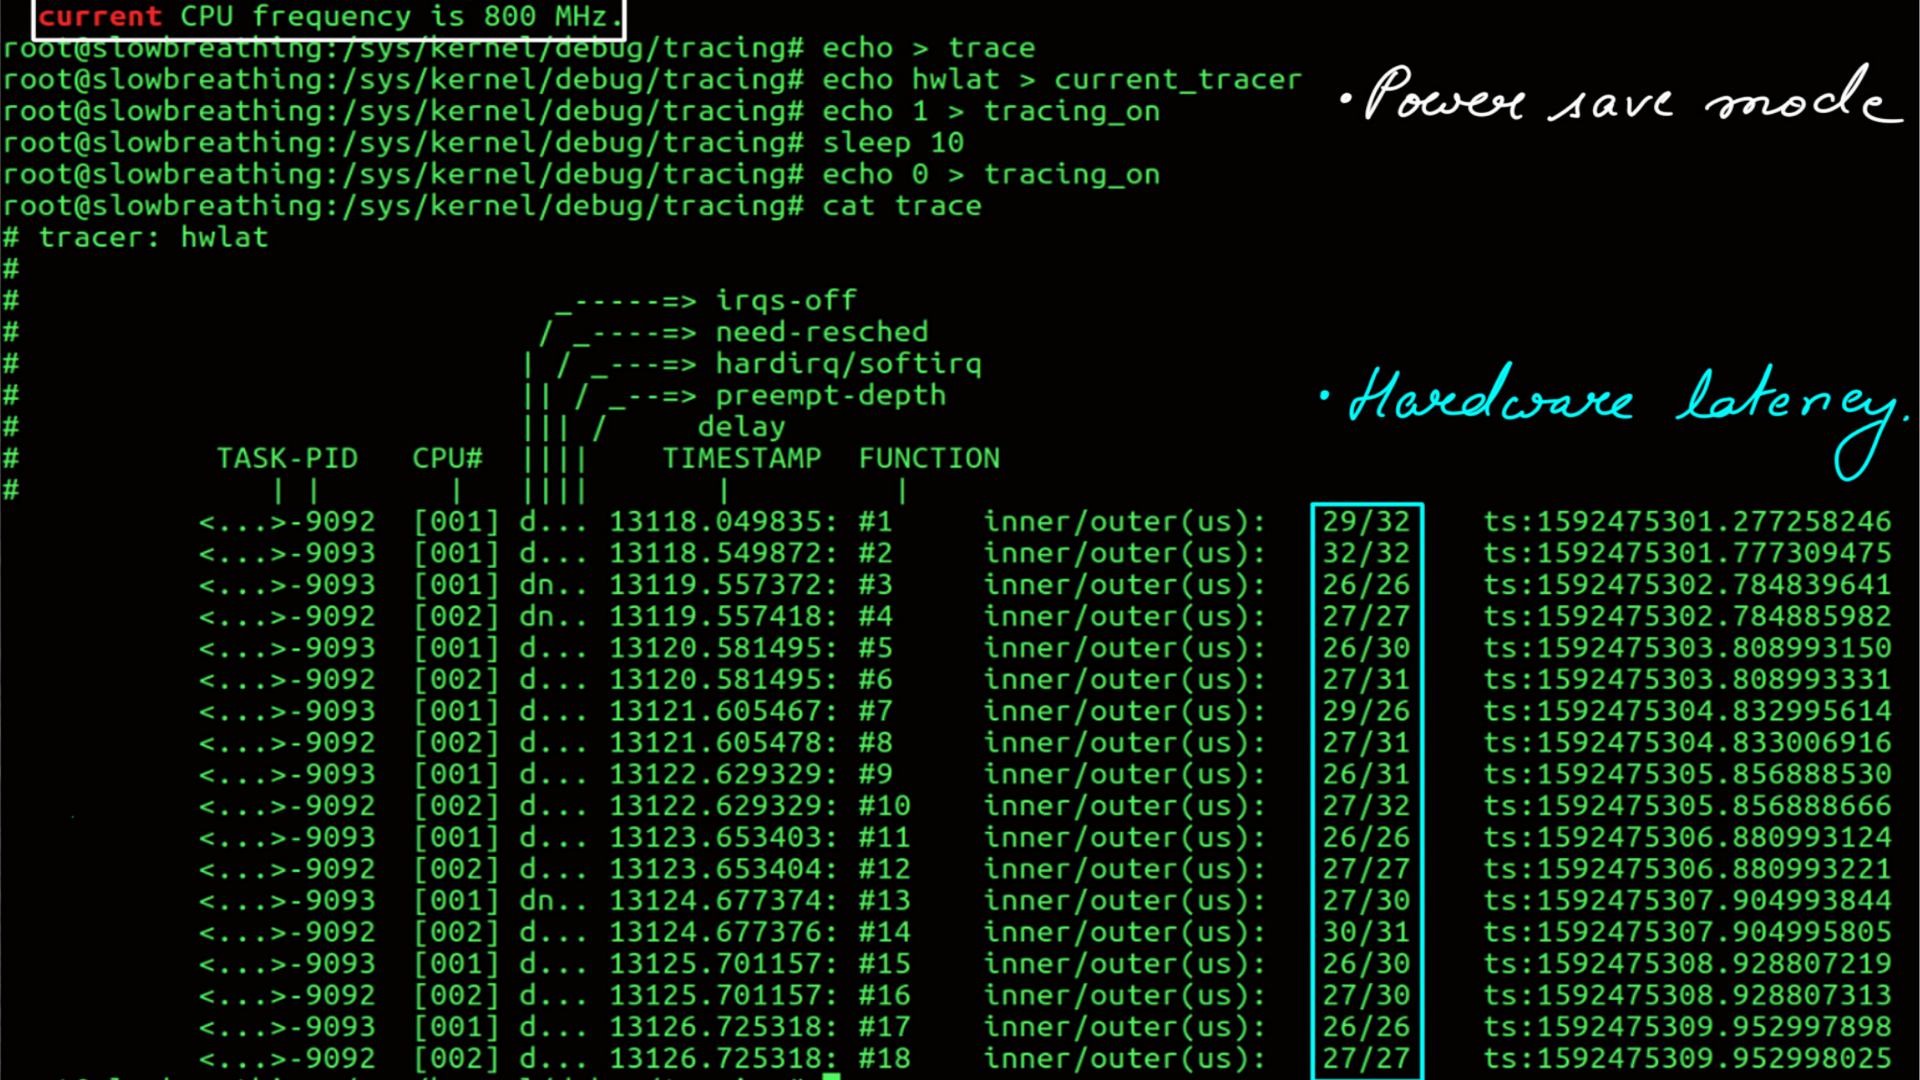
- High Frequency.
- Hardware Latency of the system.
Core and Uncore:Uncore
We’ll look at Core and Uncore again but this time from the perspective of the power interface. How much power can be saved and how much is the tradeoff in terms of latency.
- On the uncore we have L3 cache, integrated memory controller, QuickPath Interconnect (QPI; for multi-socket communication), and an interconnect that tied it all together. In the Sandy Bridge generation over and above Sandy Bridge, PCIe was integrated into the CPU uncore.
- However, just bu looking at the size and number or units on the Uncore, the potential of latency improvements here are huge
Core and Uncore:Uncore:monitoring and Tuning
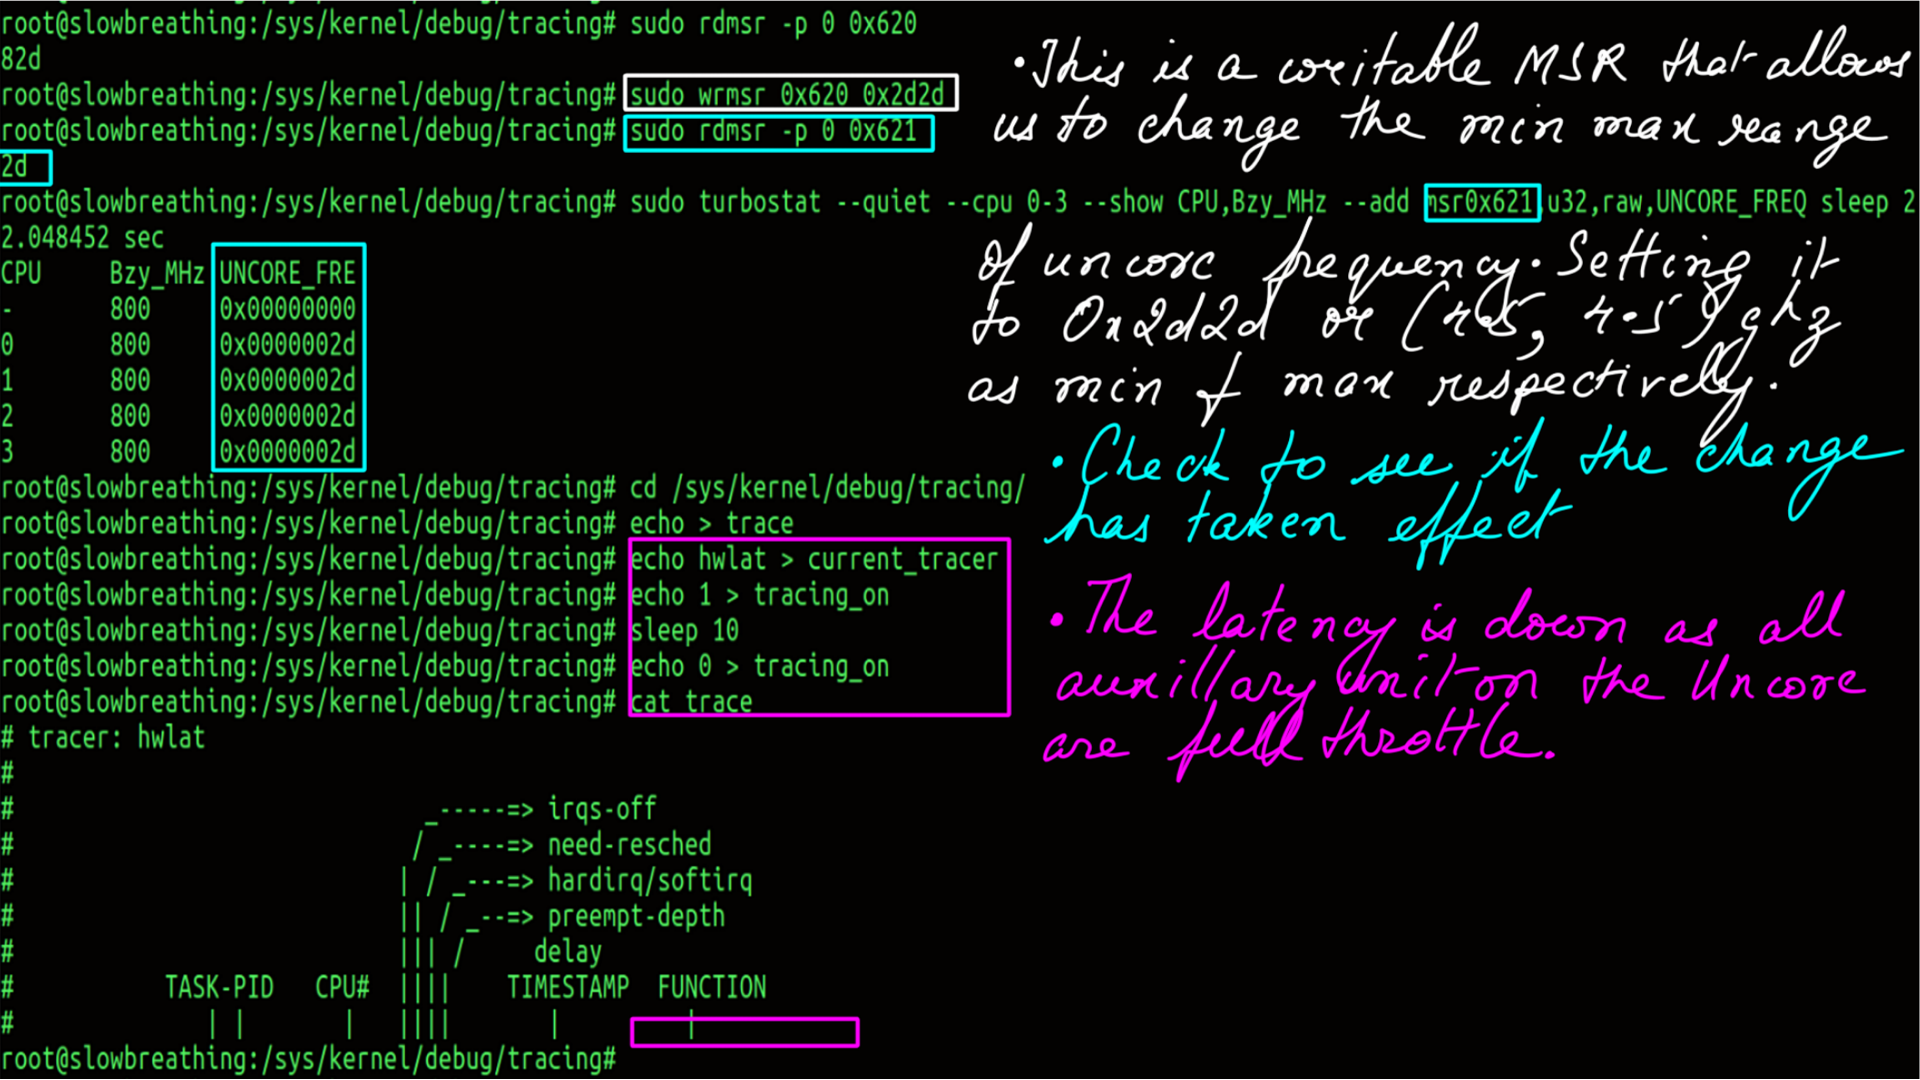
Unlike core performance monitoring, the performance monitoring architecture in the uncore is not standardized across all generations and product lines. A common architecture is used on Xeon E5/E7 products starting in the Sandy Bridge generation. Very few uncore performance monitoring capabilities have been productized on other Intel products. We read from and write to the MSRs directly. This is one of the reasons why less importance is paid to uncore. The interface to uncore is not standard. But good news is on the horizon, Intel’s UNCORE frequency driver may be part of mainline kernel as soon as kernel version 5.6. Till such time MSRs are our only hope as we are still on kernel version 4.15. But we are itching to get on to 5 series.
The uncore makes a far bigger difference because of it’s sheer size.
Core and Uncore:Uncore:monitoring and Tuning:Hardware Latency
- Low Frequency.
- Hardware Latency of the system.
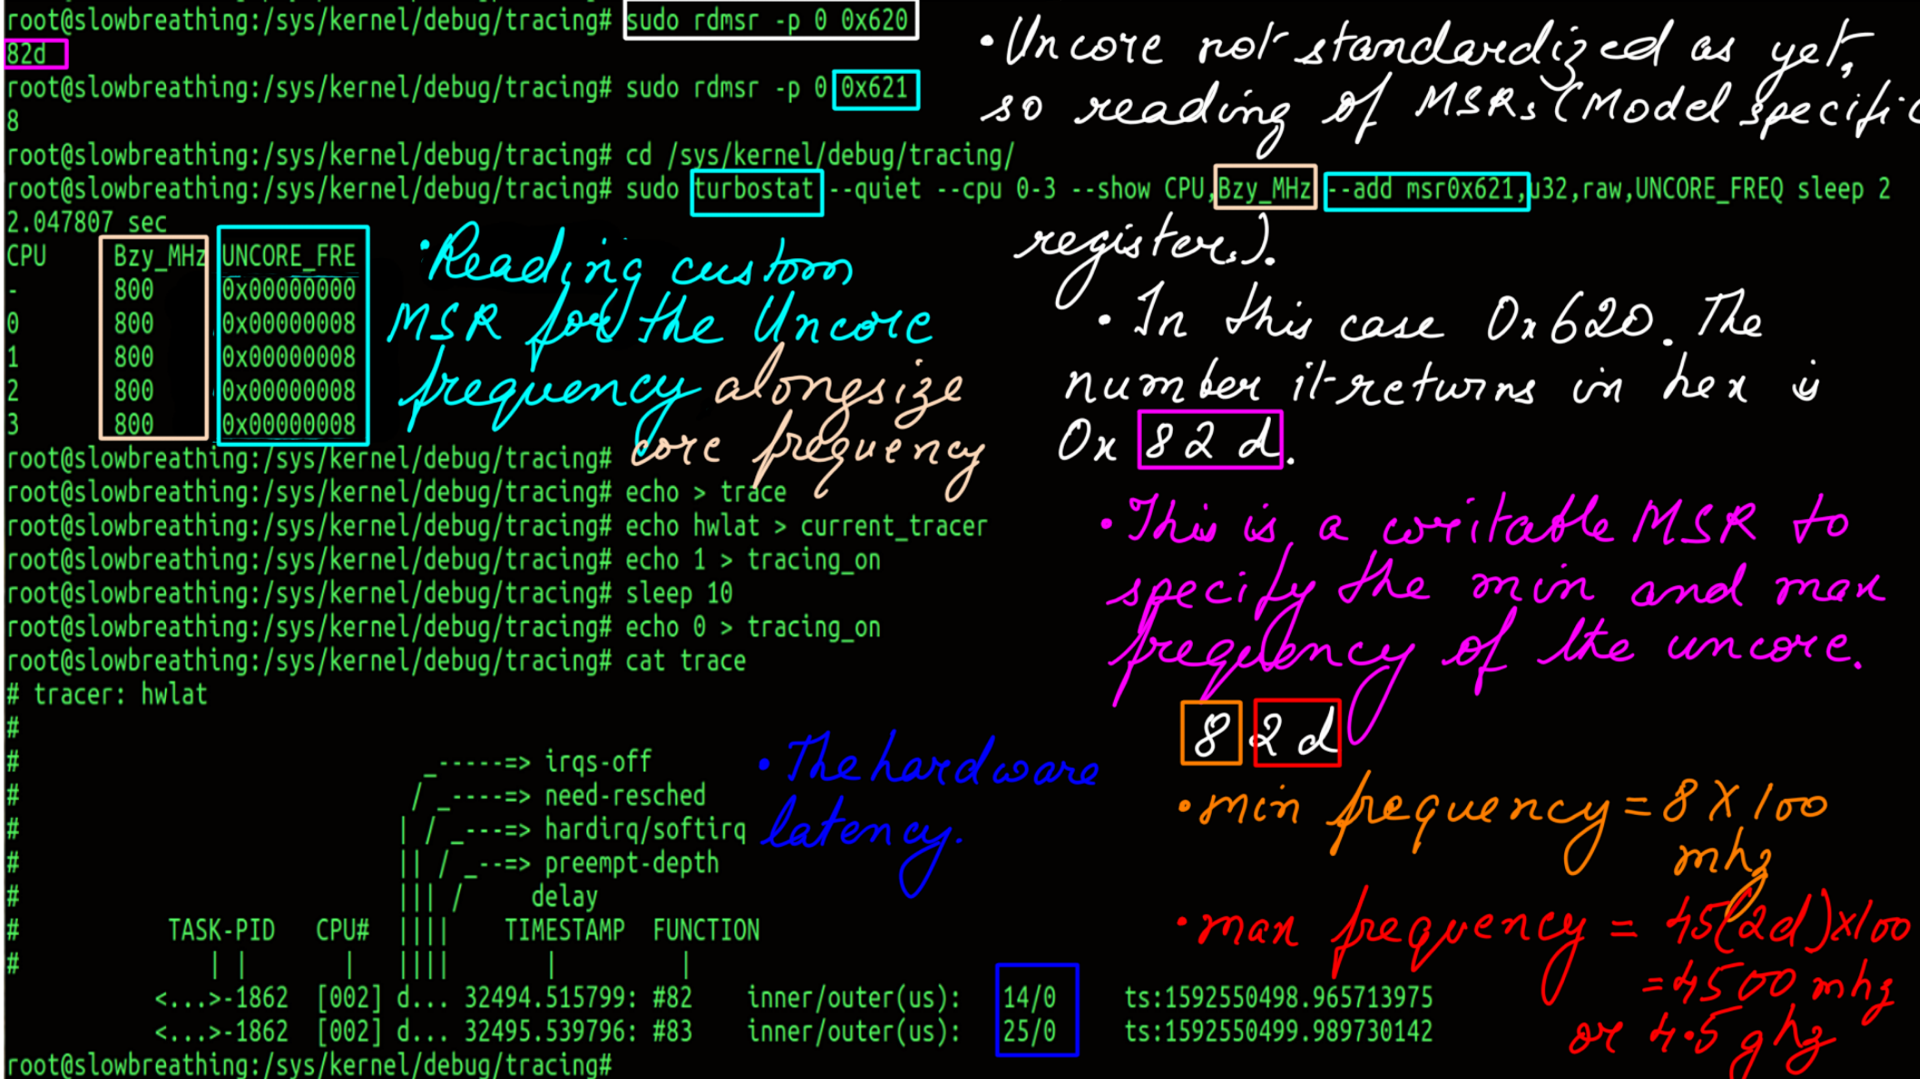
- High Frequency.
- Hardware Latency of the system.
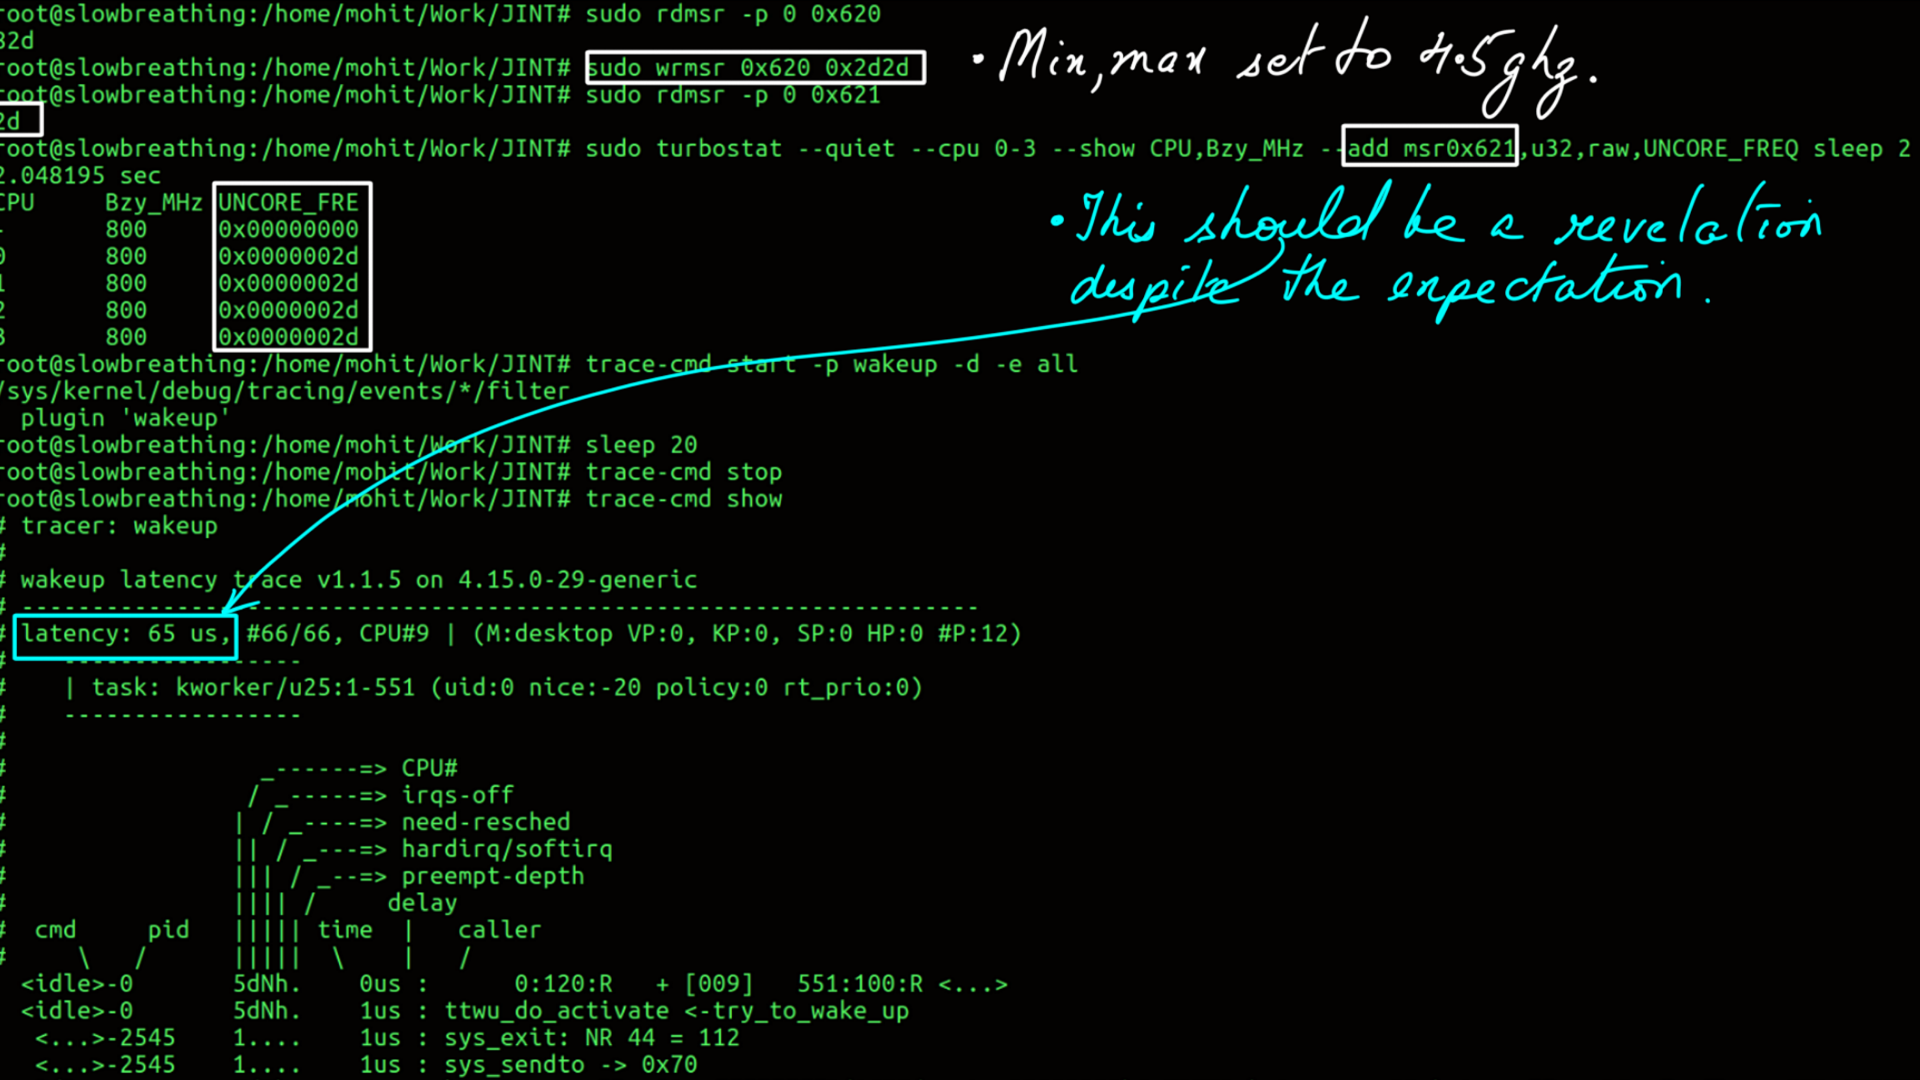
Core and Uncore:Uncore:monitoring and Tuning:Wakeup Latency
- Low Frequency.
- Wakeup Latency of the system.
- High Frequency.
- Wakeup Latency of the system.
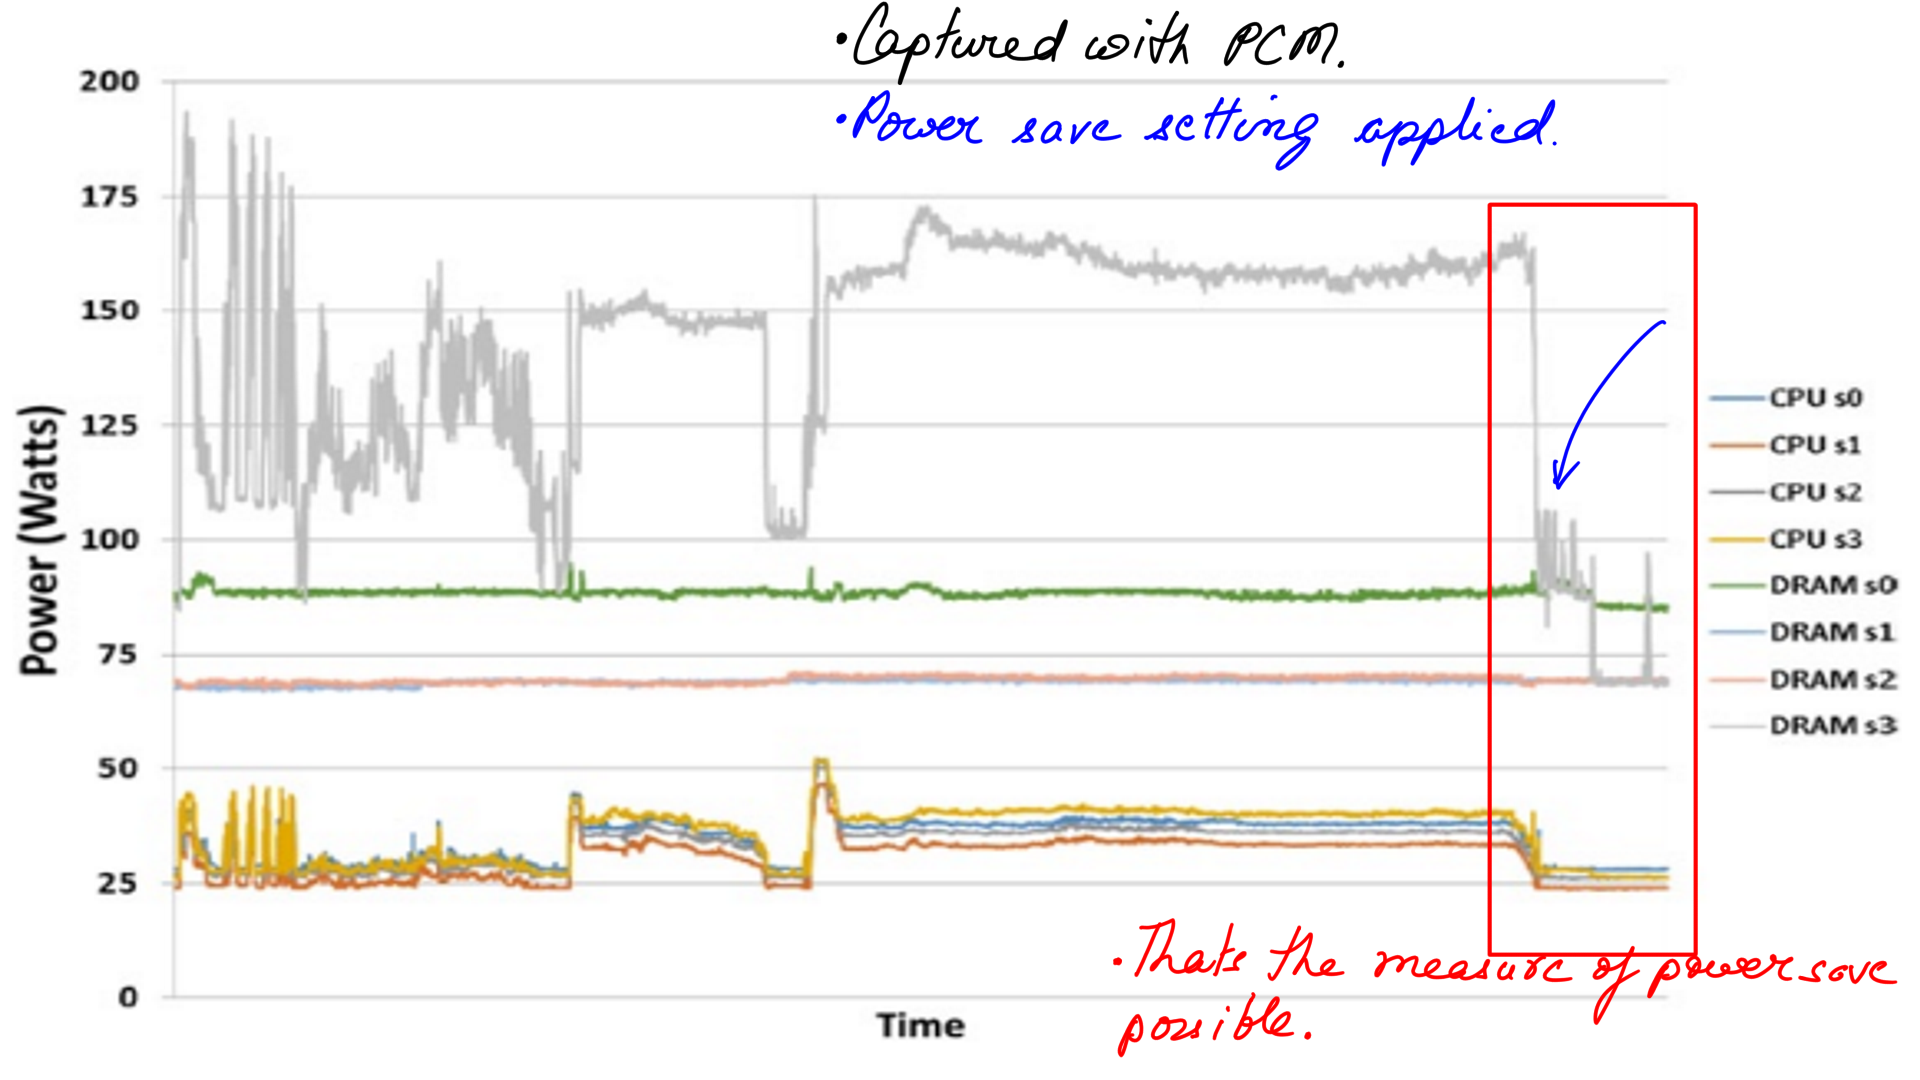
Core and Uncore:How much power can be saved
But what about power are we saving? The whole premise here is that once the load has passed over, post-configure the setting back to power save settings again based on load predictions.
- This has been measured in quad socket system using PCM.
Summary
Based on the experiments that I ran with my team, our conclusions are simple. If we consider latency, the OS jitter caused by the microprocessor per se can be almost completely eliminated. I only presented the evidence related to c-states and p-states. But this must be combined with isolcpus, affinity, irqaffinity, nohz_full, rcu_nocb, etc to have a holistic approach to eliminating jitter. A similar approach can be used for storage and network devices.
We can meditate with the whole computer system, but that would be a much bigger article series than what it already is. Last but not least, latency is the goal for this article series and the most crucial type of load we handle. But it is not the only one, it could very well be throughput or something more custom.
Glossary of terms
- PLL:A phase locked loop, or PLL, is a circuit that is used to generate a stable frequency that has a specific mathematical relationship to some reference frequenc
- VCCSA: Starting with the second-generation Core i processors (“Sandy Bridge”), the VTT voltage was renamed to VCCSA, and is called “system agent(SA).”It feeds the integrated PCI Express controller, memory controller, and display engine (i.e., the “2D” part of the graphics engine)
- VCCIO: Available starting with the second-generation Core i CPUs (“Sandy Bridge”), this voltage is used for feeding all input/output (I/O) pins of the CPU, except memory-related pins.
- GT: Integrated Grafics unit
- IA: Core CPU
- PS4: Low power mode
- VR: Voltage regulators
References
- What every programmer should know about memory: (This is a definitive 9 part(the links for the rest of the parts are embedded in the first one.) article on how the hardware works and, how software and data structure design can exploit it. It had a huge impact on the way I thought and still do think about design. The article first came out in 2007 but it is still relevant which is proof that basics don’t change very often.)
- Intels documenation: (Intel’s documentation is the authentic source here. But, it is incredibly difficult to read. It is as if Intel’s employees were given a raise to make it “impossible to comprehend” kind of document.)
- Agner Fog: (He benchmarks microprocessors using forward and reverse engineering techniques. My bible.)
- Linux Source: (If you are going to trace your programs/applications then having the Linux source is a must. Tracers will tell you half the story, the other half will come from here. )
- Transformer: (Modern Natural Language processing, in general, must be indebted to Transformer architecture. We however, use an asymmetric transformer setup.)
- Performer-A Sparse Transformer: (This is as cutting edge as it can get. The transformer at the heart of it is a stacked multi-headed-attention unit. As the sequences(of words or System events or stock prices or vehicle positions e.t.c.) get longer, the quadratic computation and quadratic memory for matrix cannot keep up. Performer, a Transformer architecture with attention mechanisms that scale linearly. The framework is implemented by Fast Attention Via Positive Orthogonal Random Features (FAVOR+) algorithm.)
- Ftrace: The Inner workings ( I dont think there is a better explaination of Ftrace’s inner workings.)
- Ftrace: The hidden light switch: ( This article demonstrates the tools based on Ftrace.)
- BPF: ( eBPF or just BPF is changing the way programming is done on Linux. Linux now has observability superpowers beyond most OSes. A detailed post on BPF is the need of the hour and I am planning as much. In the meantime, the attached link can be treated as a virtual BPF homepage.)