Artificial Intelligence especially deep learning employs extremely complex models. Complexity stems from two major sources.
- Firstly, Models that have multiple dimensional representations have to be expressed mathematically. Often these models(RNNs, LSTMs, NMTs, BERTs) also has a time dimension that have to be represented as well adding to the complexity.
- Secondly, the mathematical model has to be translated to code and executed on CPUs/GPUs. When I illustrate these models in later articles, one realizes the importance of looking at the whole stack or at least have an understanding of the whole stack. This enables, in the very least, easier debugging. At best, one understands the model’s execution and behavior and modifications that require to be done to suit our specific use-case(s).
In my experience, for most clients I have work for, the single most important reason why models underperform is that the hyperparameters are not understood well and hence most often misconfigured. If from hardware to the software model and everything in between is understood well, then Deep Learning becomes fun and magic. This blog over the next couple of months will try to lower the barrier to entry.
Being in the Optimisation field for quite some time, I have understood the importance of how stuff works under-the-hood. I have a microarchitecture background, specifically X86 and vector-based architectures. Microarchitecture has been my guiding light. It has helped me solve many complex optimization problems despite some of them being programmed in high-level languages like Java or python.
In this short post, which has nothing to do with Artificial Intelligence just yet, I demonstrate the importance of understanding stuff under-the-hood and thinking in pictures and then linking it to the code.
Importance of understanding stuff under-the-hood
Let us say that one wants to understand the underlying assembler for a high-level language and the way it executes on a CPU( at least theoretically ;-)). An easy way to understand this is to look at the usage convention for x86 general-purpose registers and do a light reading on the various operations support by the x86 architecture. Once this is known the code becomes extremely clear. Let us understand this with a very simple C program before we do this for a higher-level language.
static inline void mwait_idle_with_hints(unsigned long eax, unsigned long ecx)
{
if (static_cpu_has_bug(X86_BUG_MONITOR) || !current_set_polling_and_test()) {
if (static_cpu_has_bug(X86_BUG_CLFLUSH_MONITOR)) {
mb();
clflush((void *)¤t_thread_info()->flags);
mb();
}
__monitor((void *)¤t_thread_info()->flags, 0, 0);
if (!need_resched())
__mwait(eax, ecx);
}
current_clr_polling();
}
Listing-1static inline void mwait_idle_with_hints(unsigned long eax, unsigned long ecx)
{
if (static_cpu_has_bug(X86_BUG_MONITOR) || !current_set_polling_and_test()) {
if (static_cpu_has_bug(X86_BUG_CLFLUSH_MONITOR)) {
mb();
clflush((void *)¤t_thread_info()->flags);
mb();
}
__monitor((void *)¤t_thread_info()->flags, 0, 0);
if (!need_resched())
__mwait(eax, ecx);
}
current_clr_polling();
}
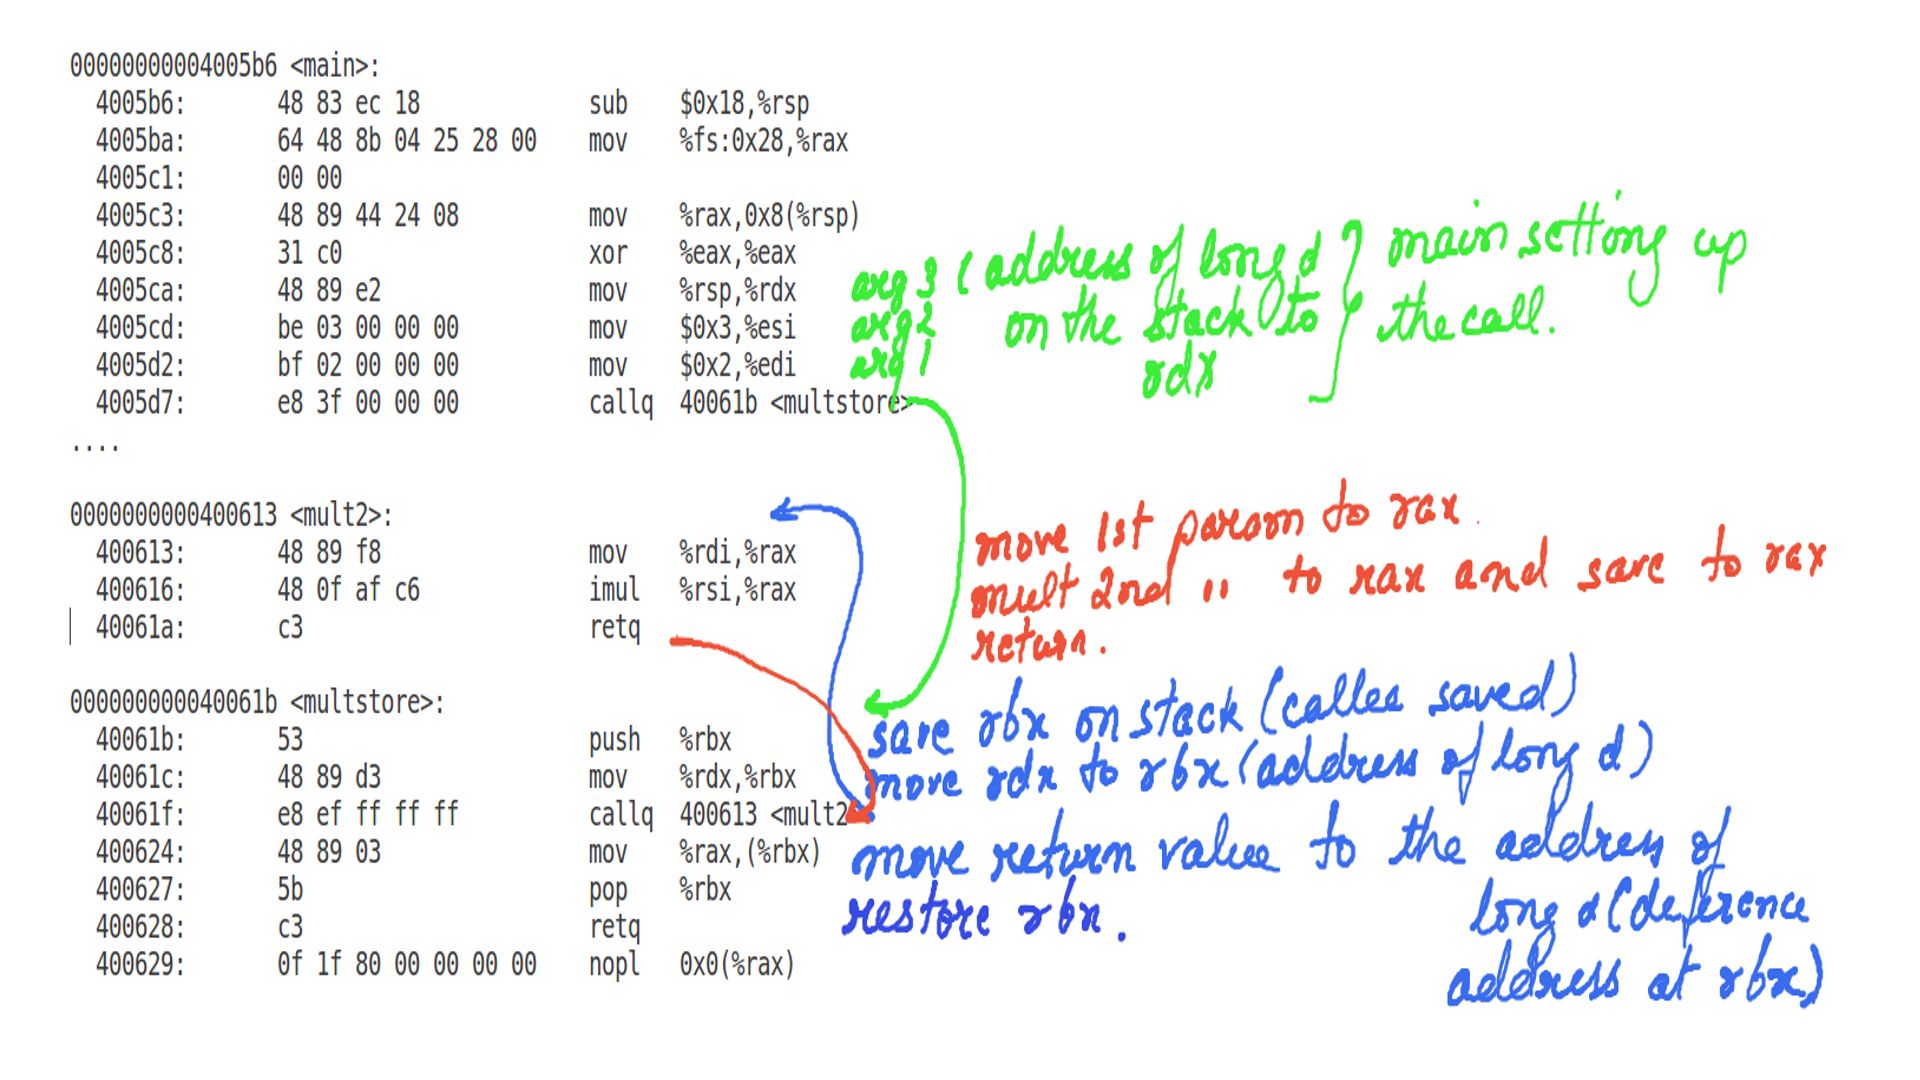
Listing-2Consider the above code where “main” calls “multstore” and “multstore” calls “mult2”.
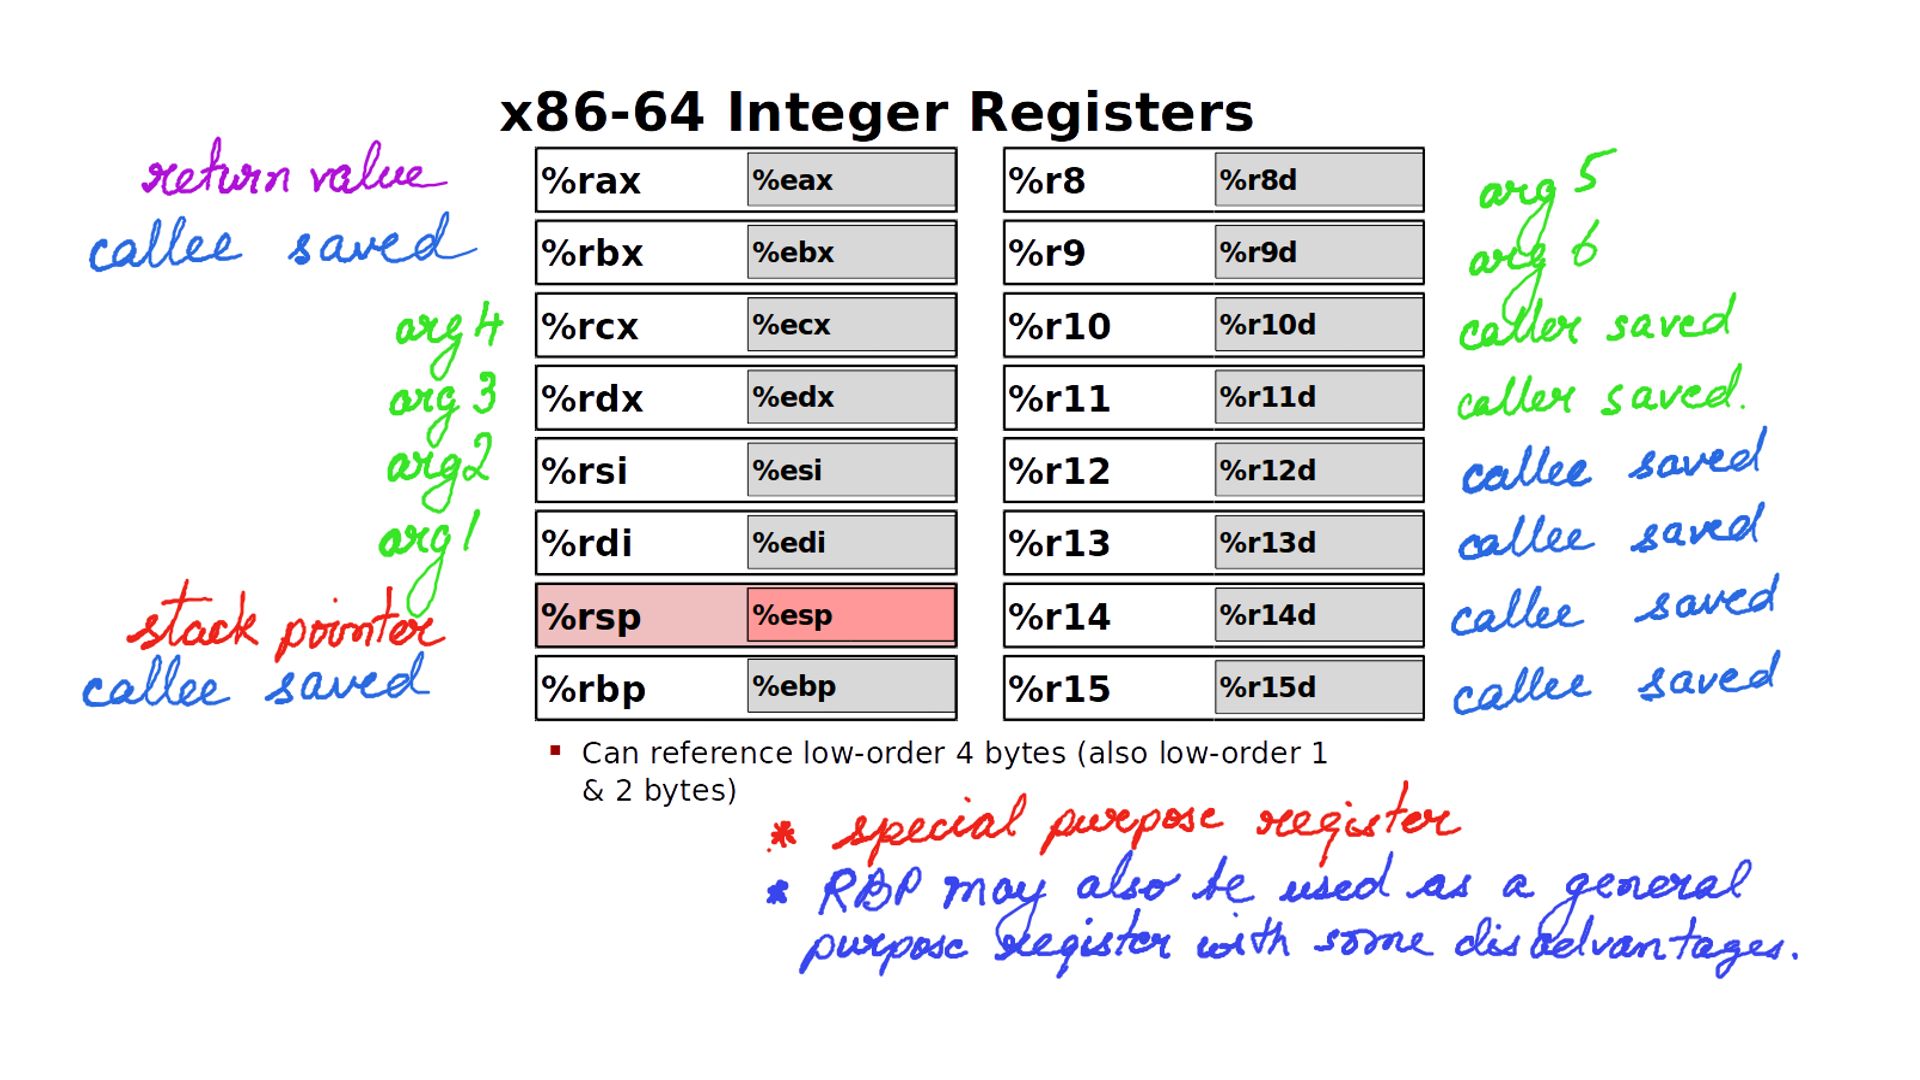
Compilers have the above convention in mind for x86 register usage. This is usually done so that software written by different people and often compiled by different compilers can interact with each other.
- callee-saved: If a function A calls function B function B cannot change the values of these registers. This can be done by either not changing values at all or pushing values from these registers to the stack on entry and restoring them on exit.
- caller-saved: If a function A calls function B then, it means it can be modified by anyone. Caller-saved because if the caller has some local data in these registers then it is caller’s responsibility to save it before making the call.
For the most part, the above figure should clarify the use of registers in x86. Since the basic idea is clear, the same can be extended for higher-level languages.
Extending the general idea of registers to higher level languages(Java)
private static class Shape{
public Shape(List<Point> shape) {
for (Point shape1 : shape) {
if(this.head==null){
this.head=this.tail=shape1;
size++;
}
else{
this.tail.next=shape1;
size++;
this.tail=shape1;
}
}
}
Shape next;
Point head;
Point tail;
int size;
void movex(int offset){
Point tmpnext=this.head;
while(tmpnext!=null){
tmpnext.x=tmpnext.x+offset;
tmpnext=tmpnext.next;
}
}
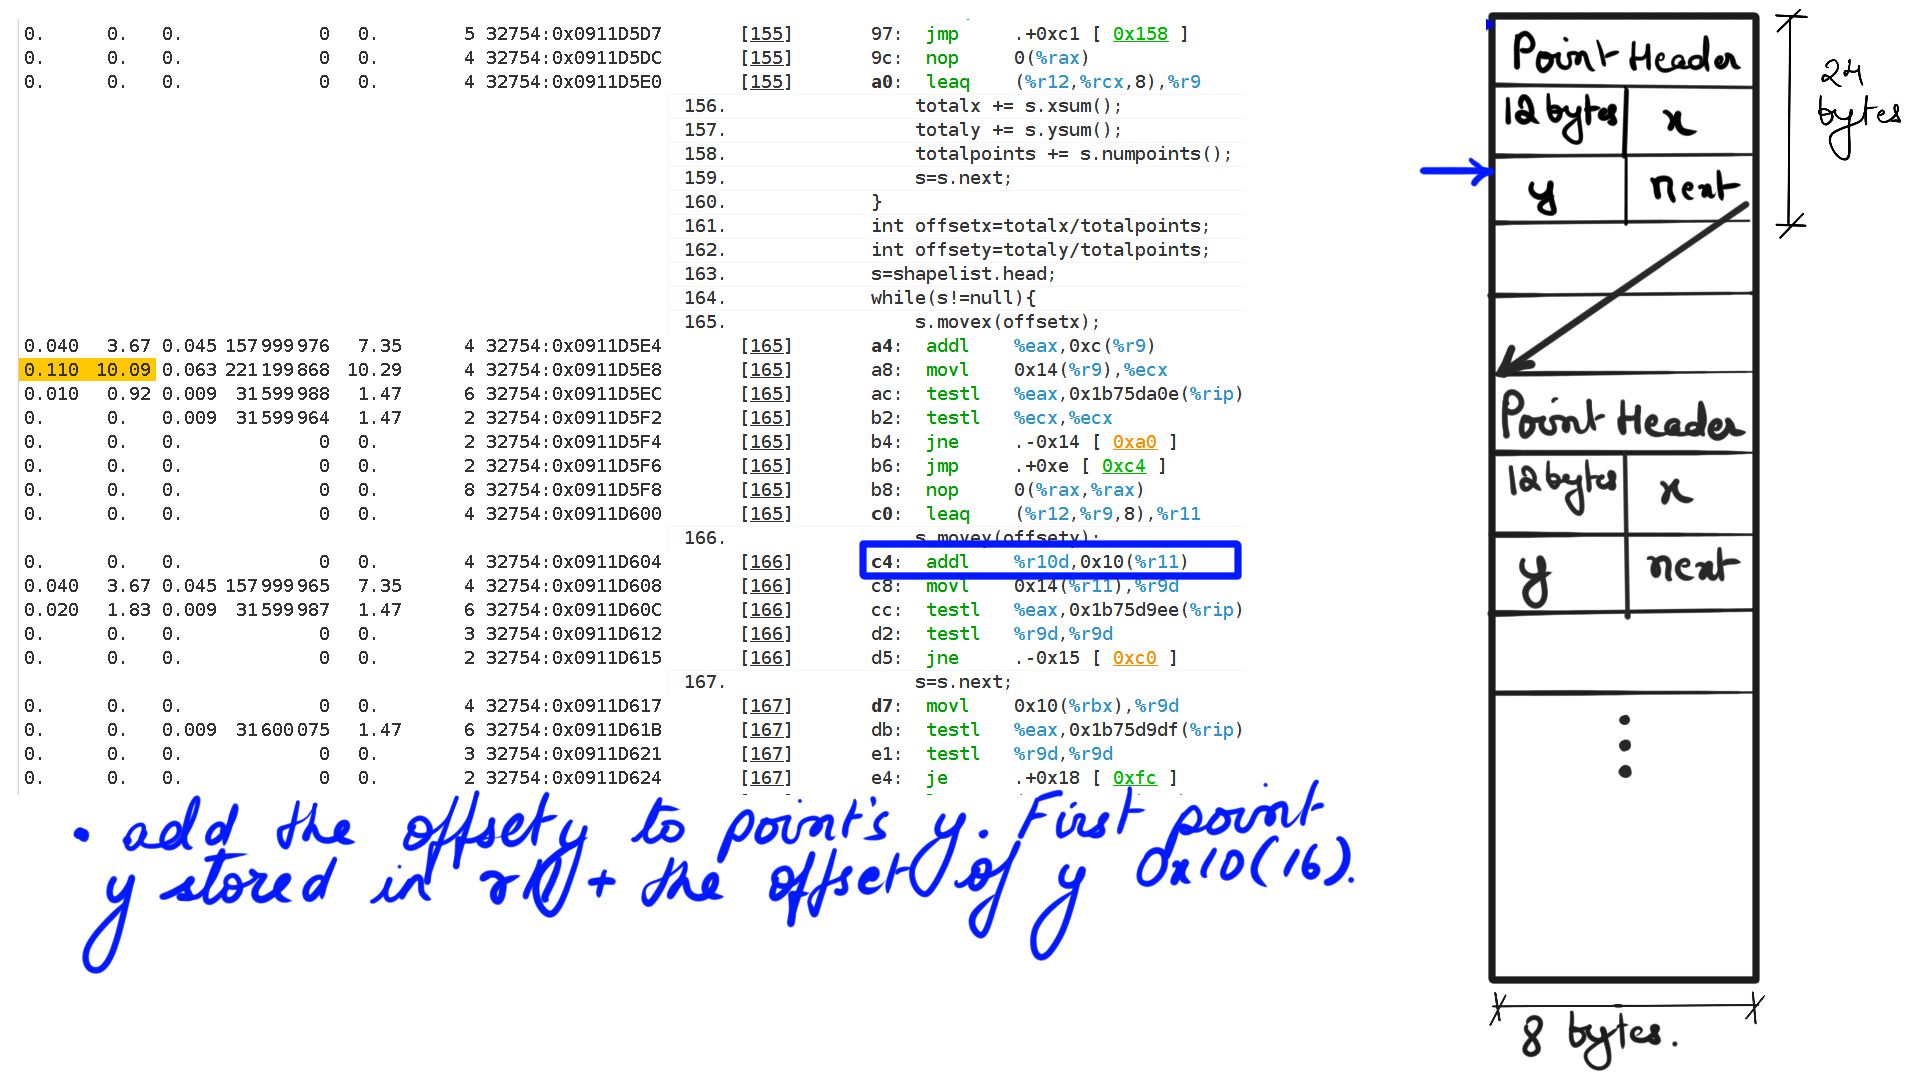
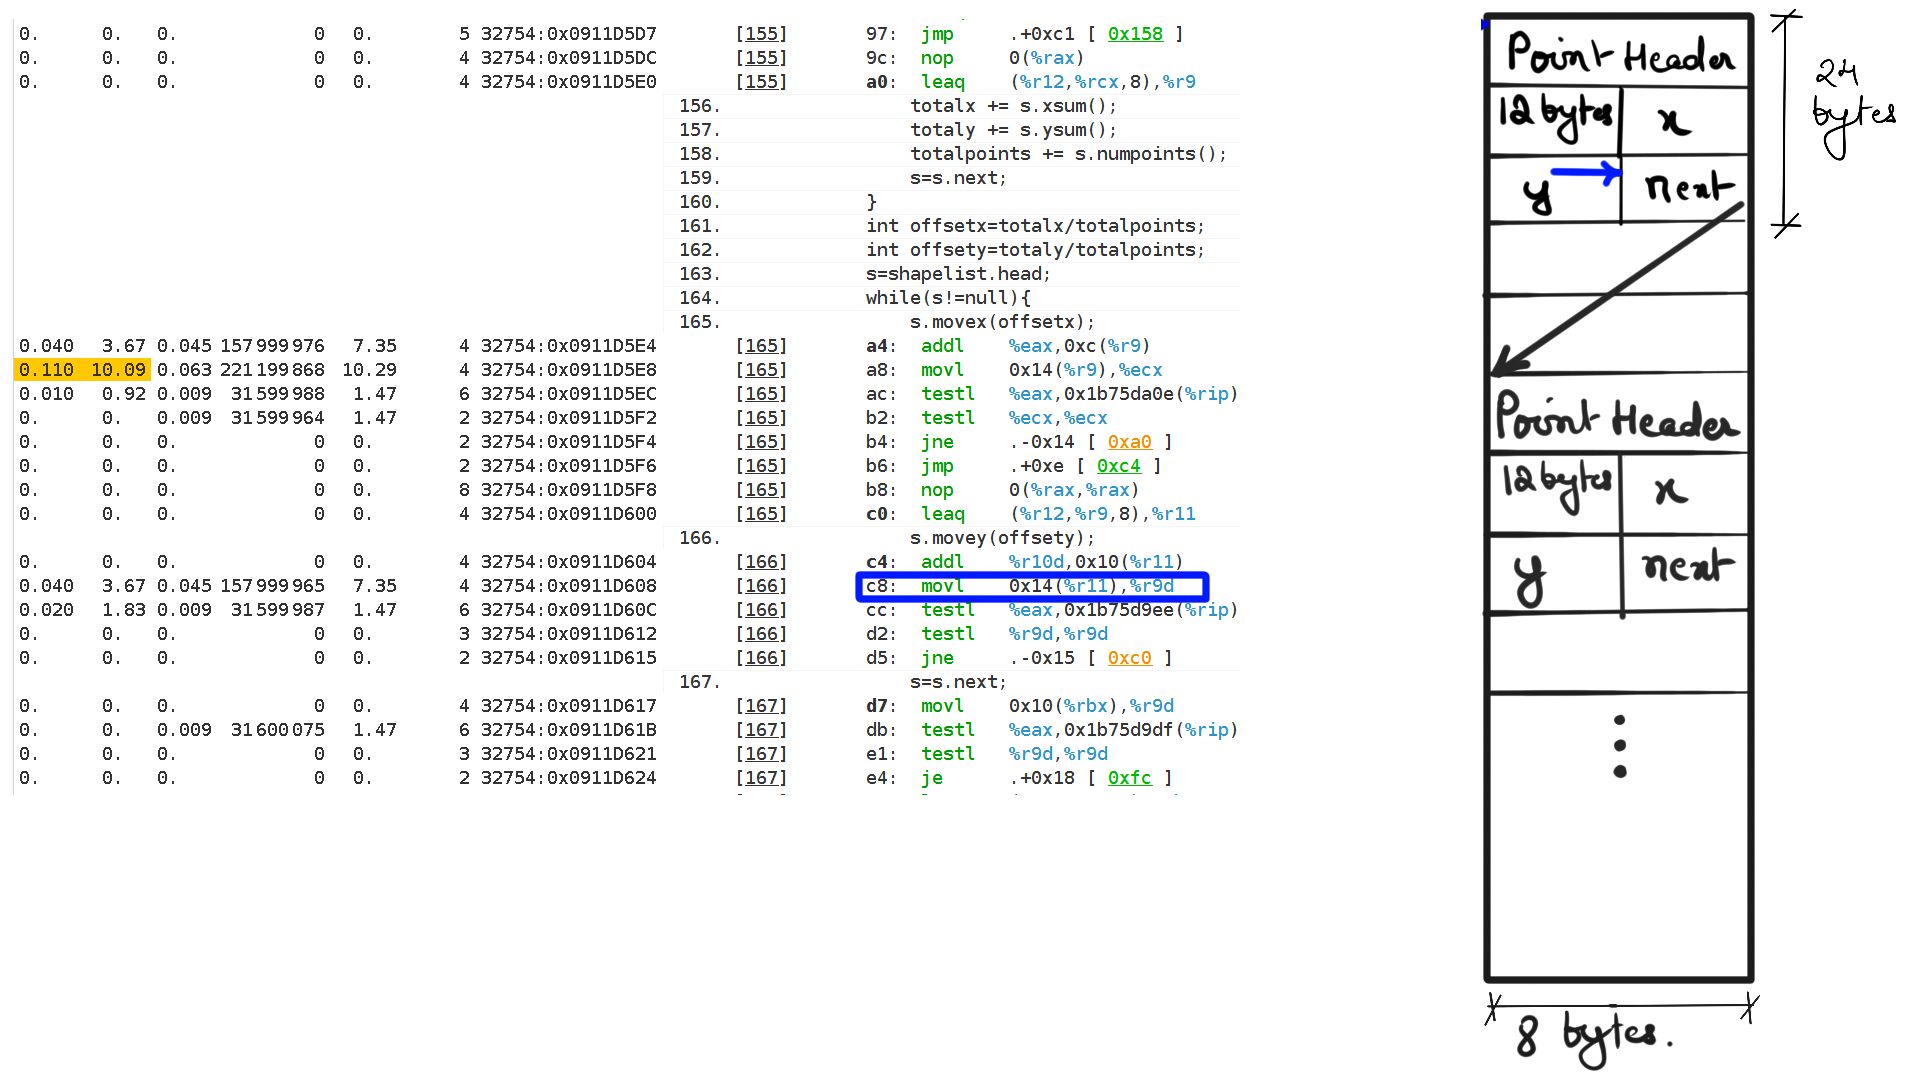
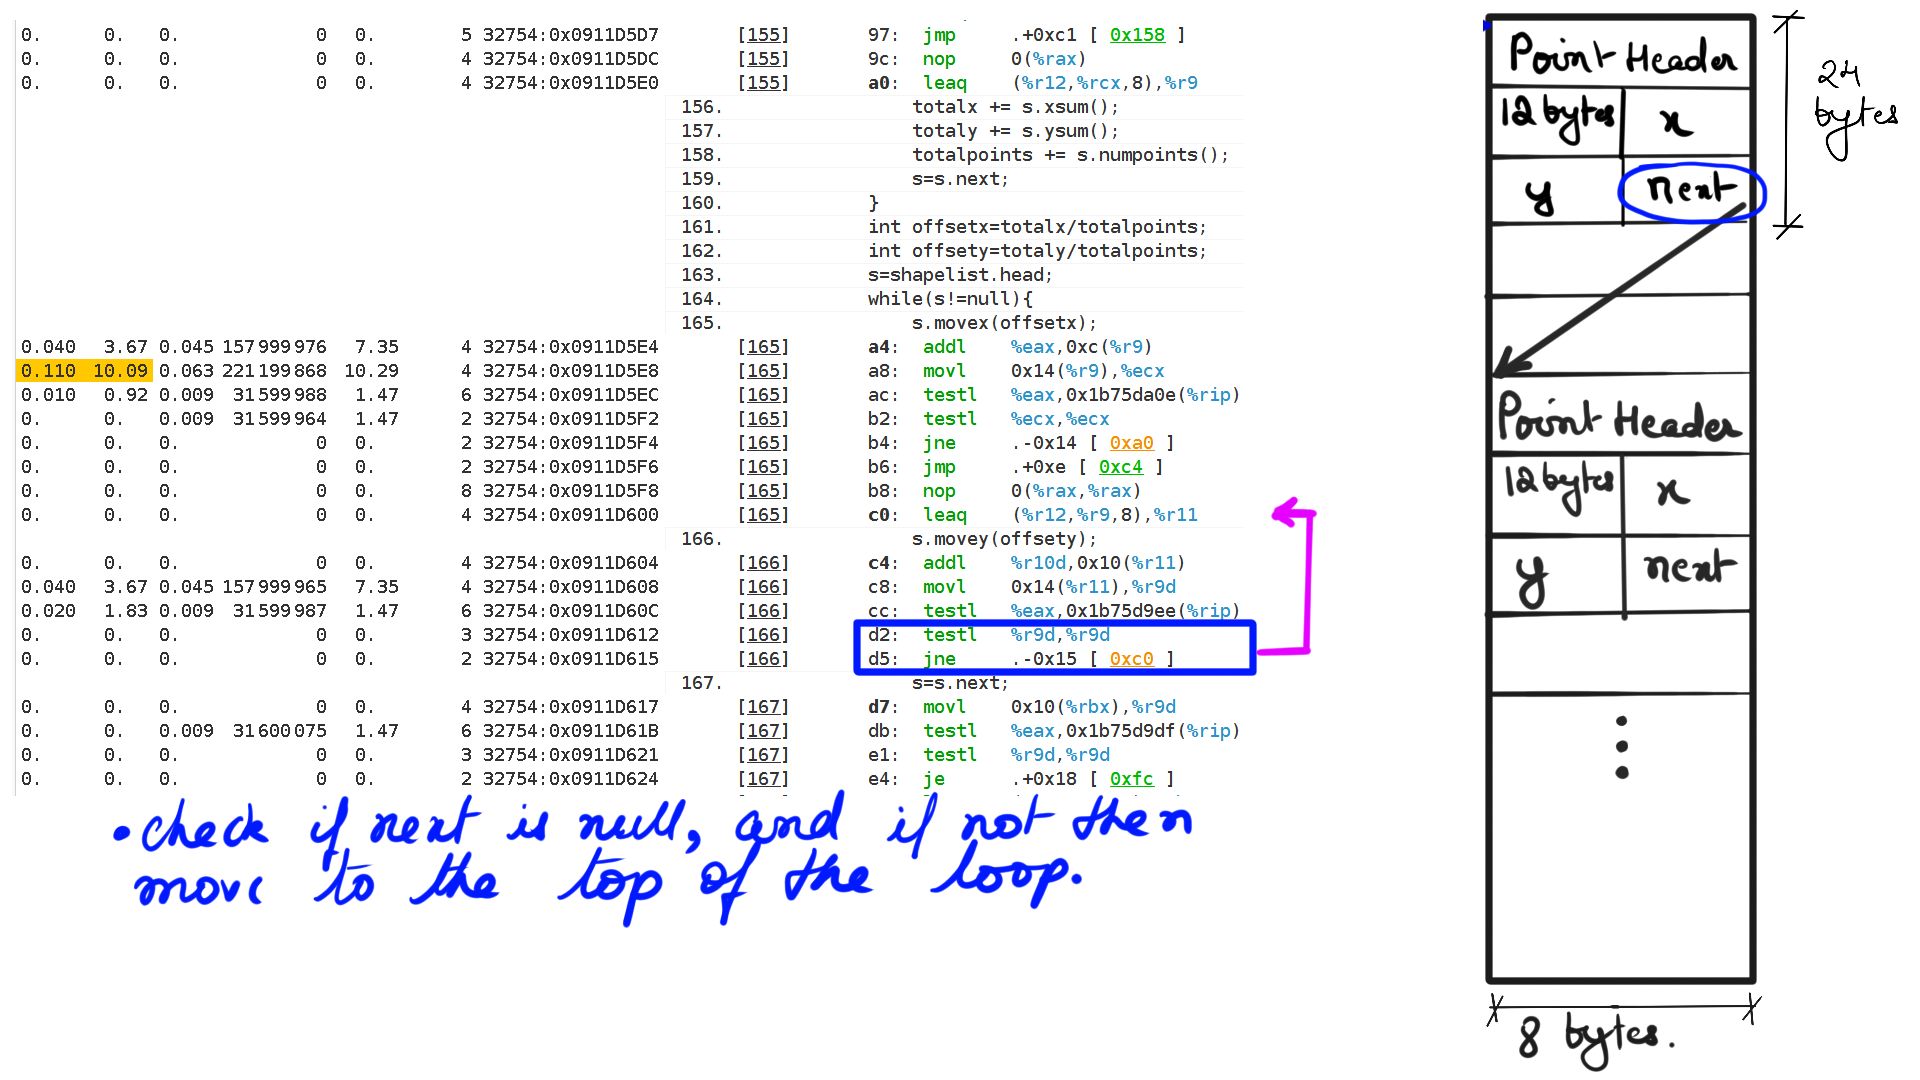
void movey(int offset){
Point tmpnext=this.head;
while(tmpnext!=null){
tmpnext.y=tmpnext.y+offset;
tmpnext=tmpnext.next;
}
}
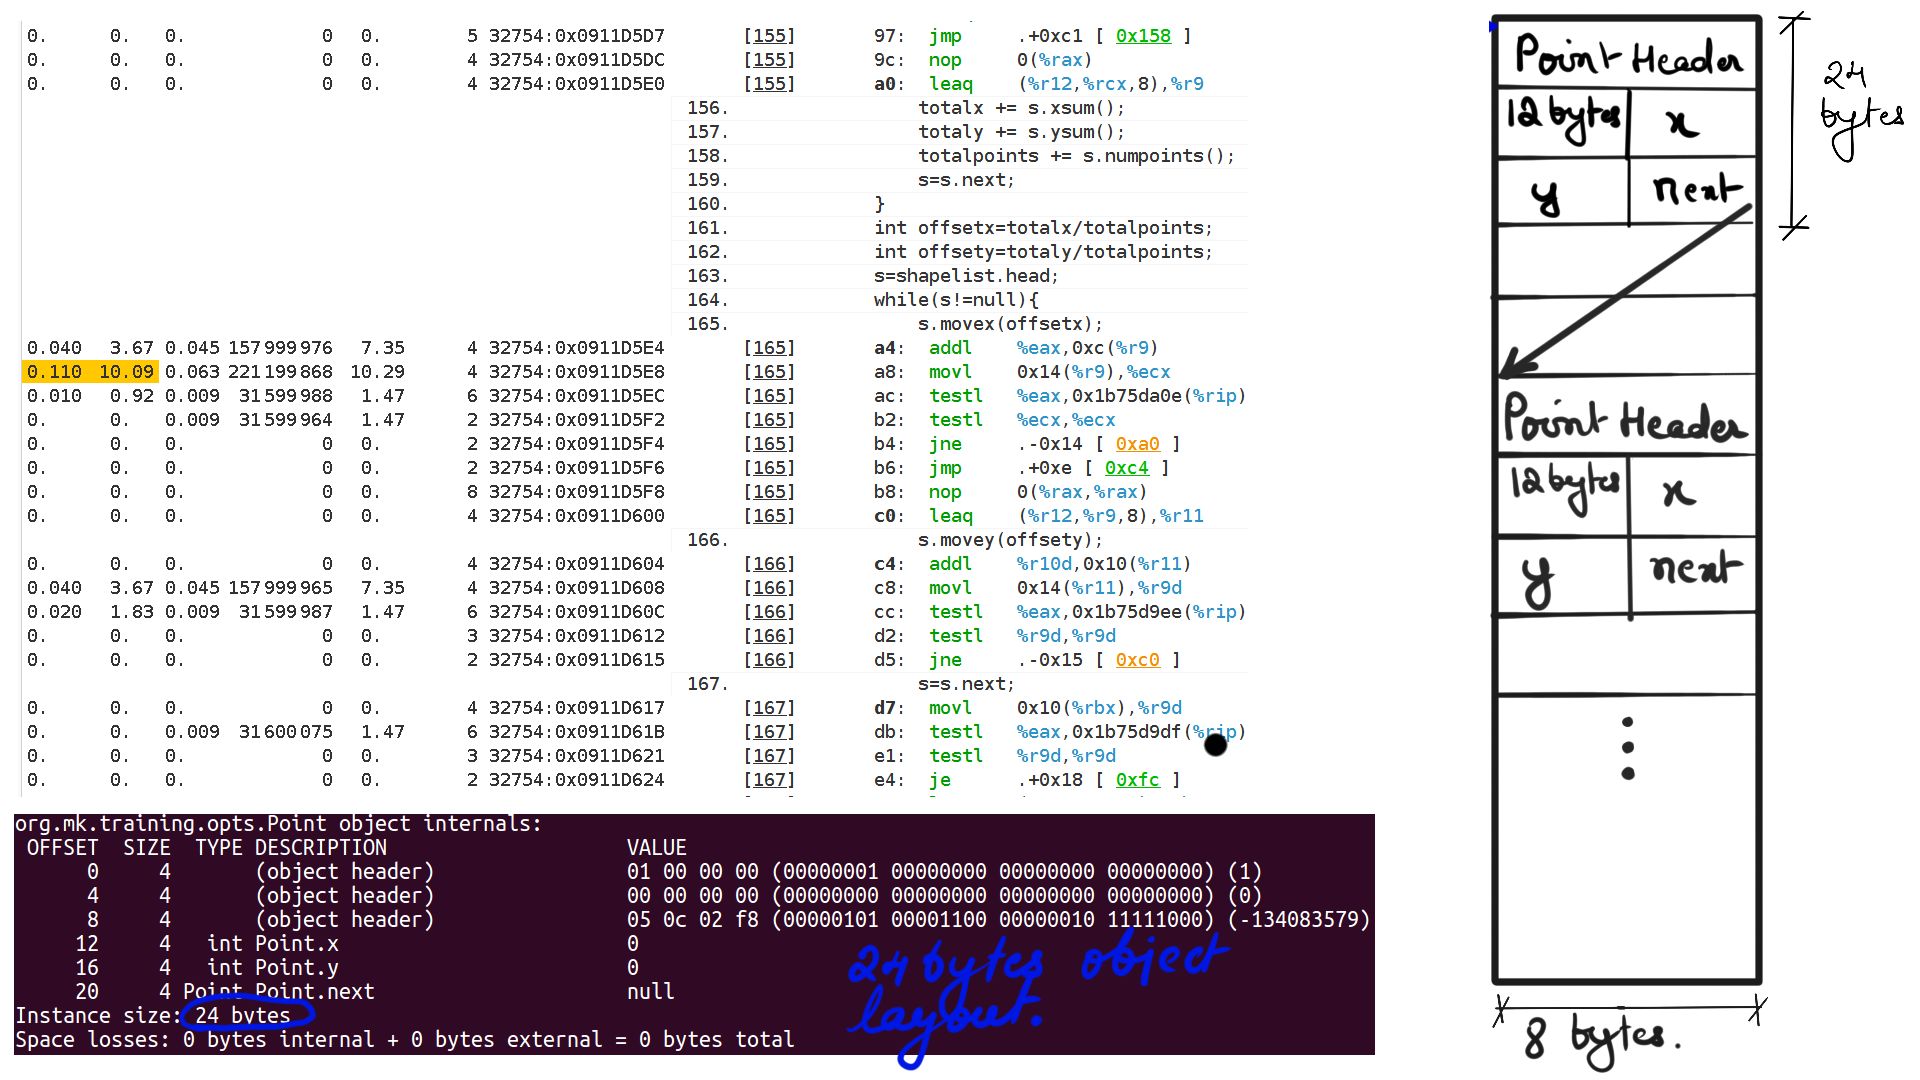
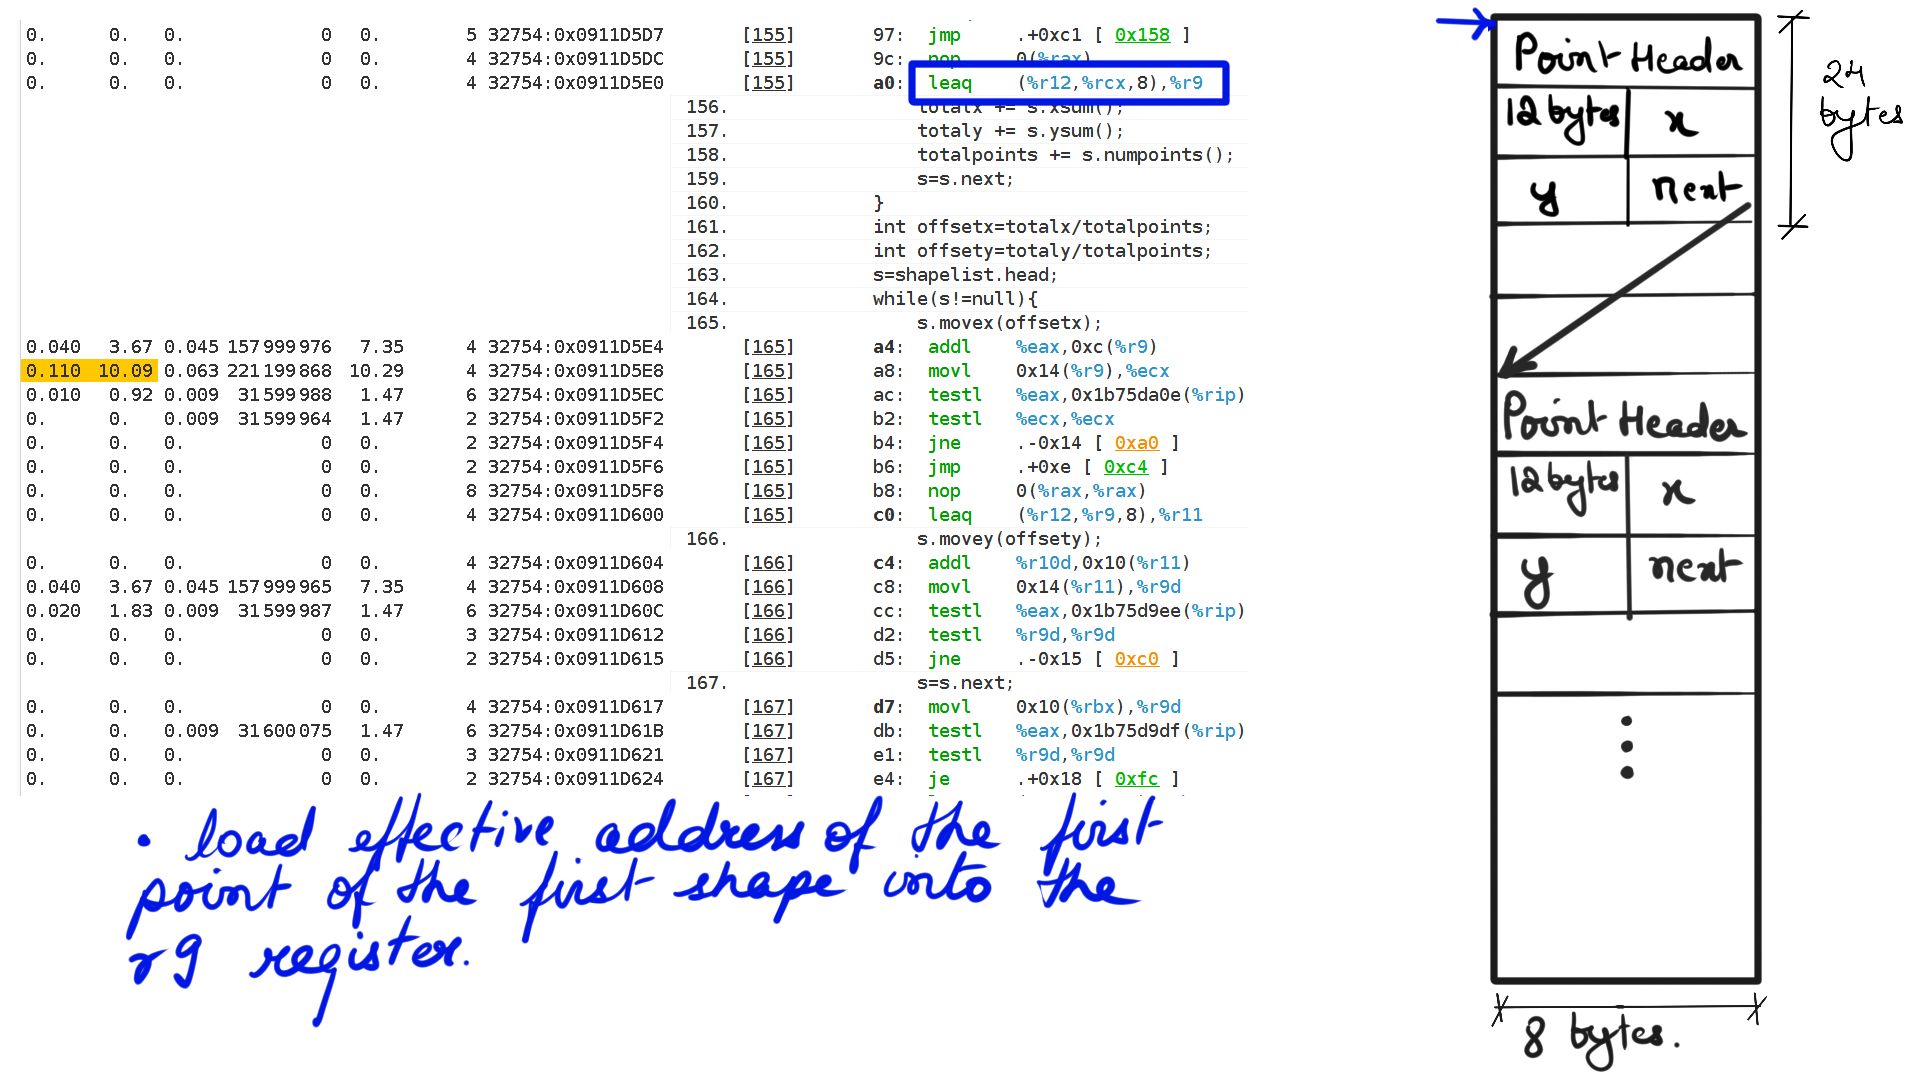
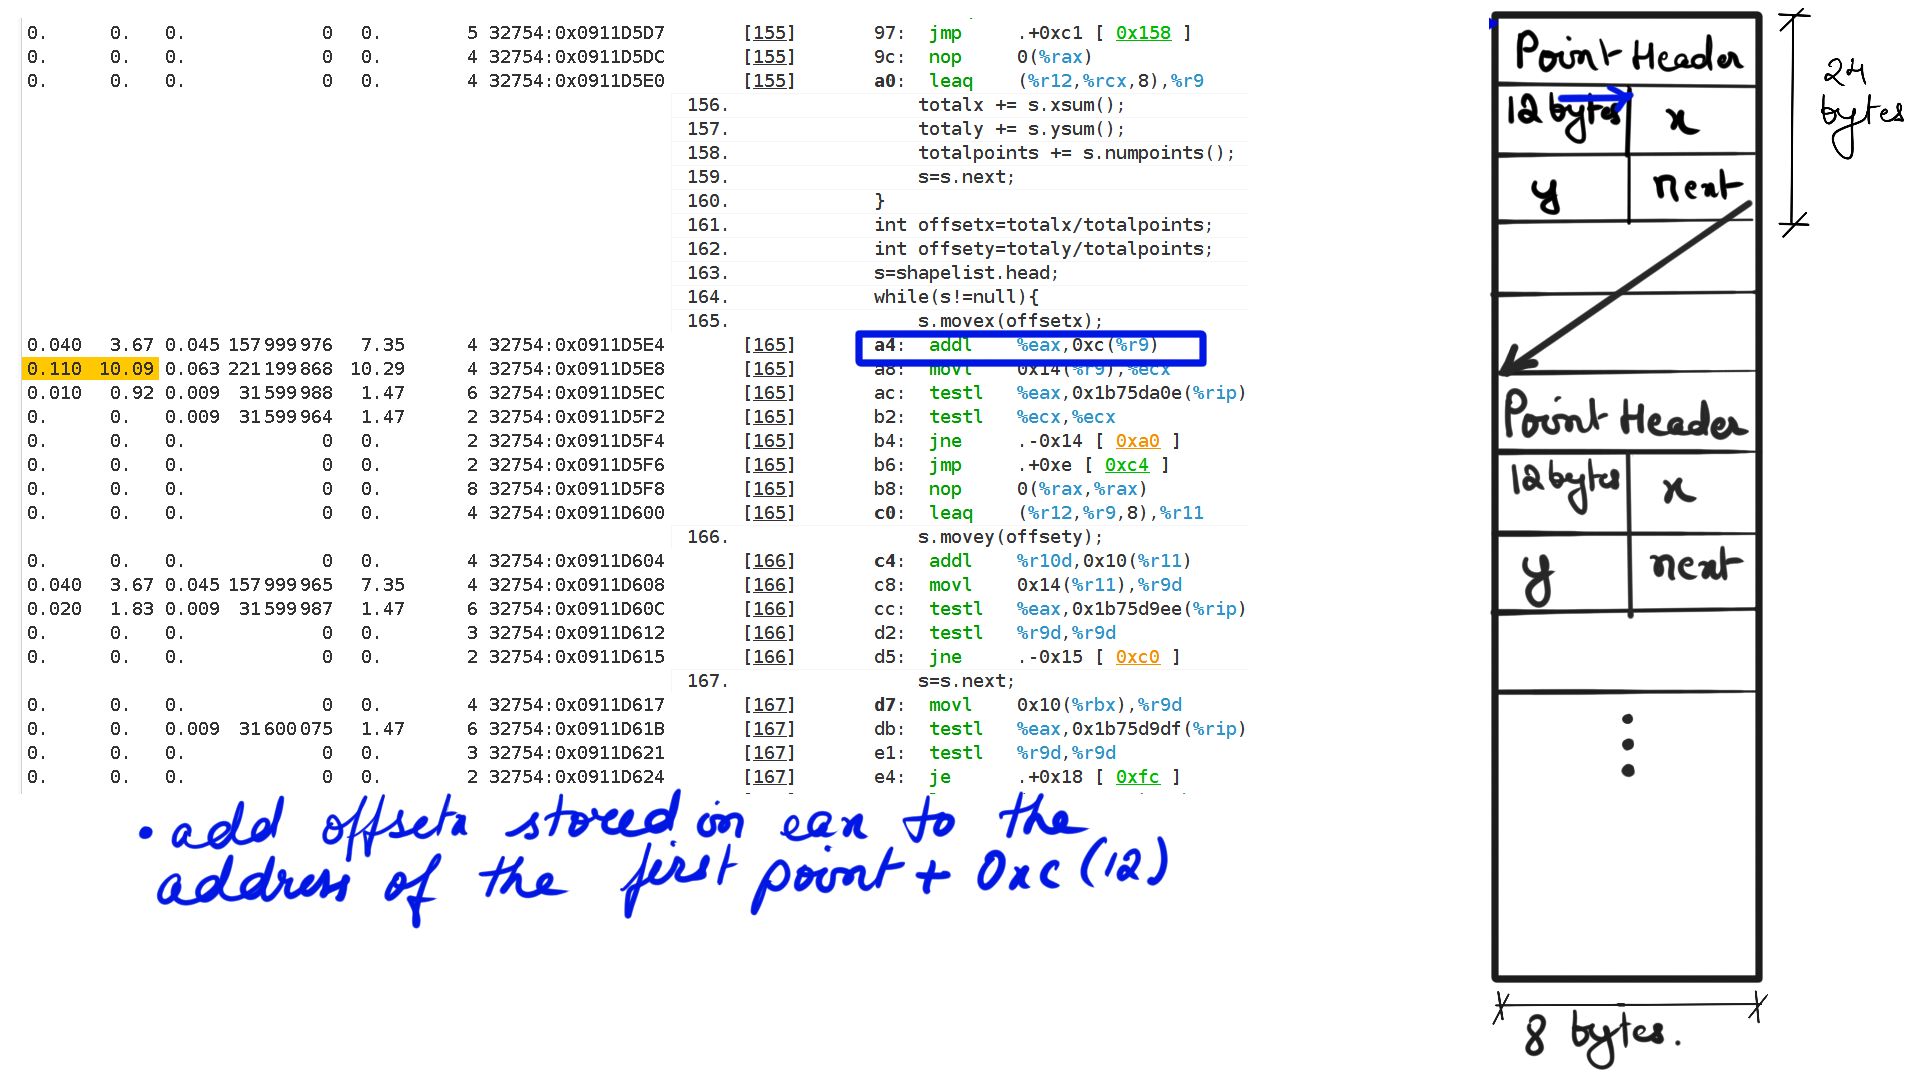
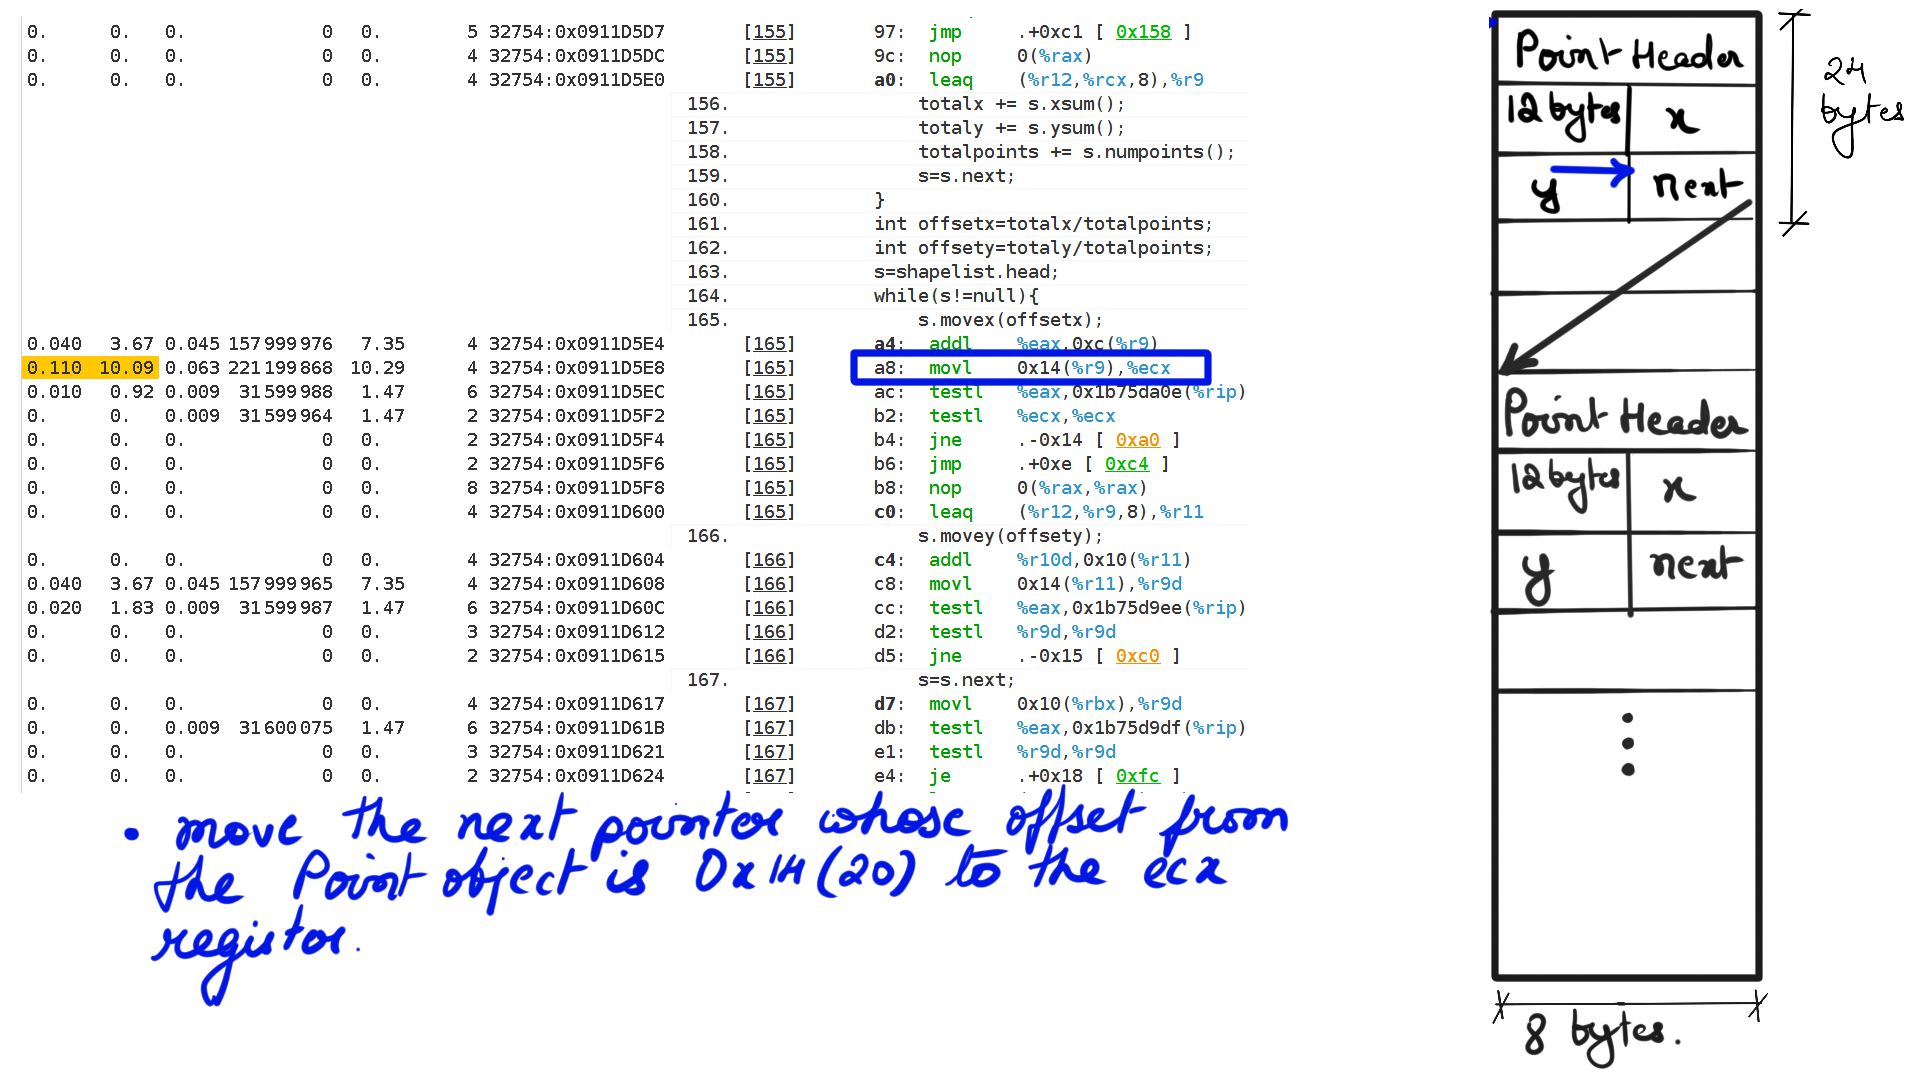
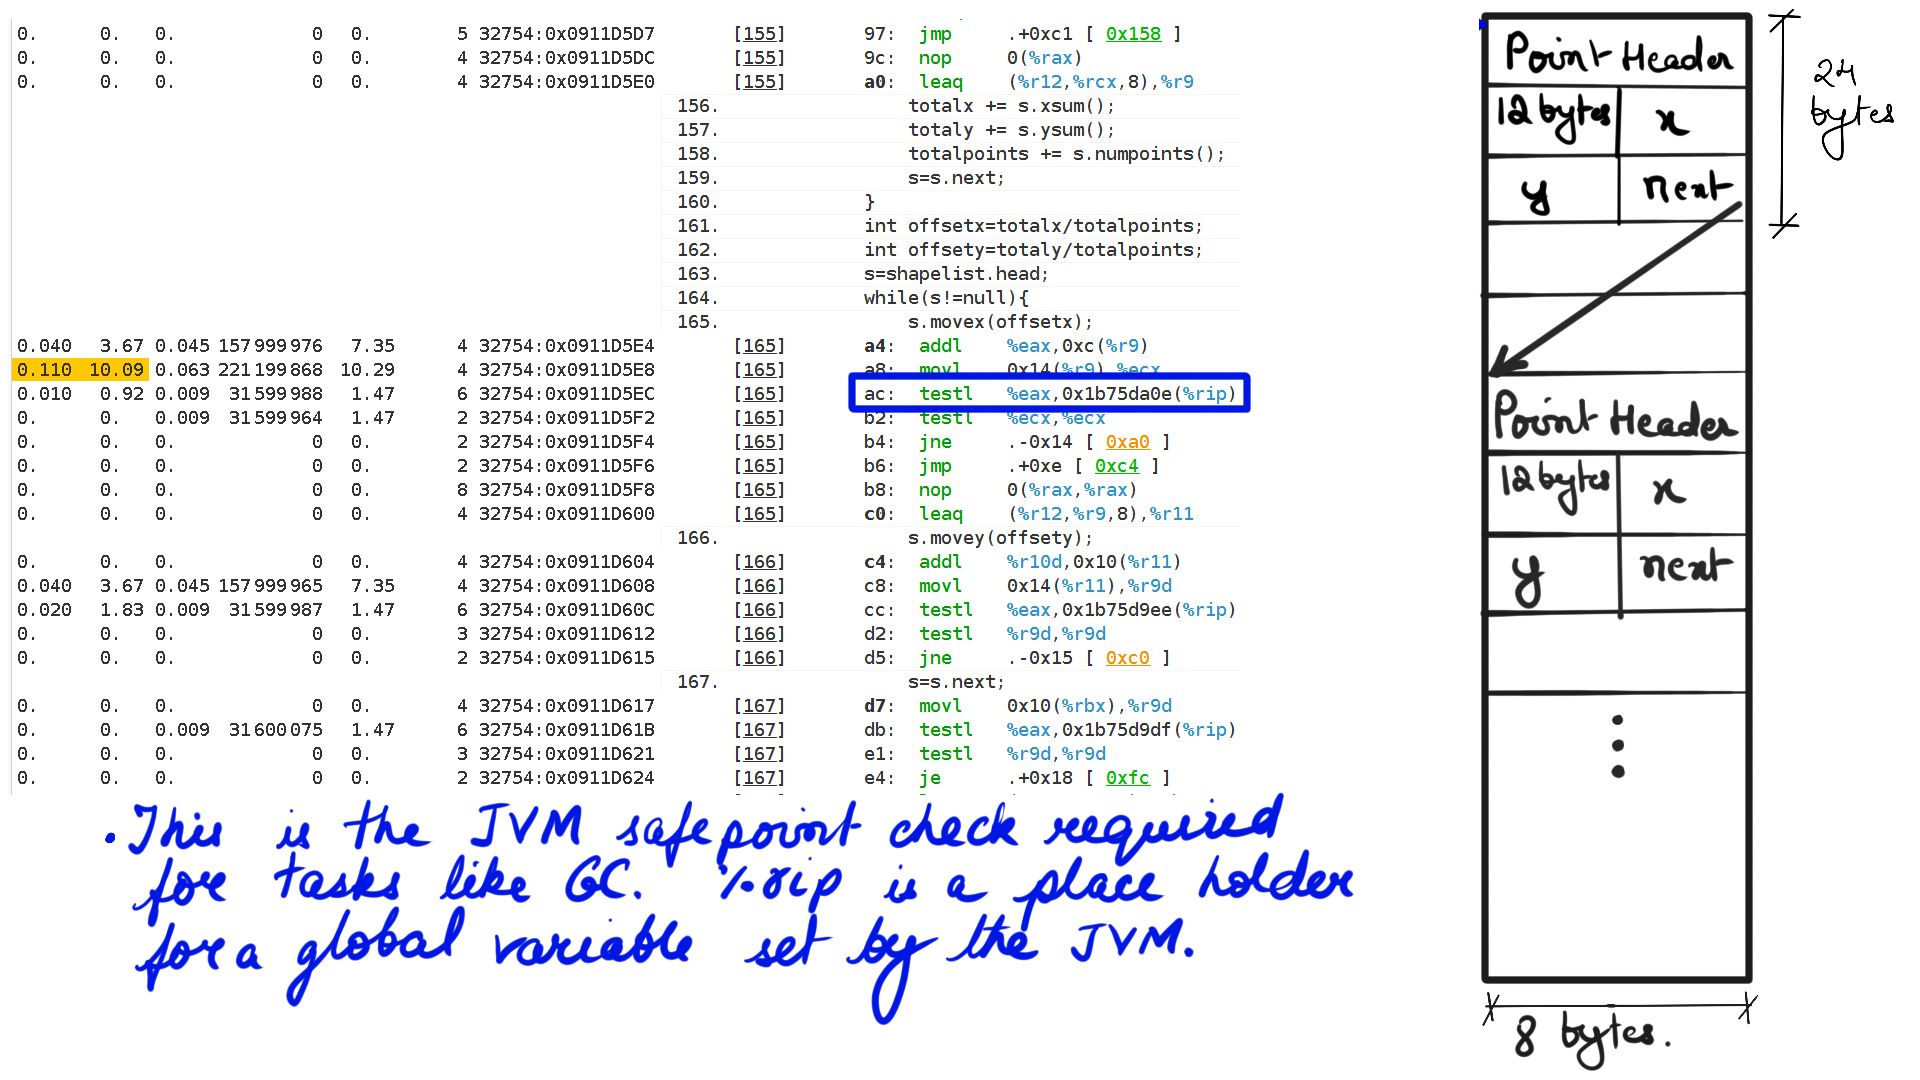
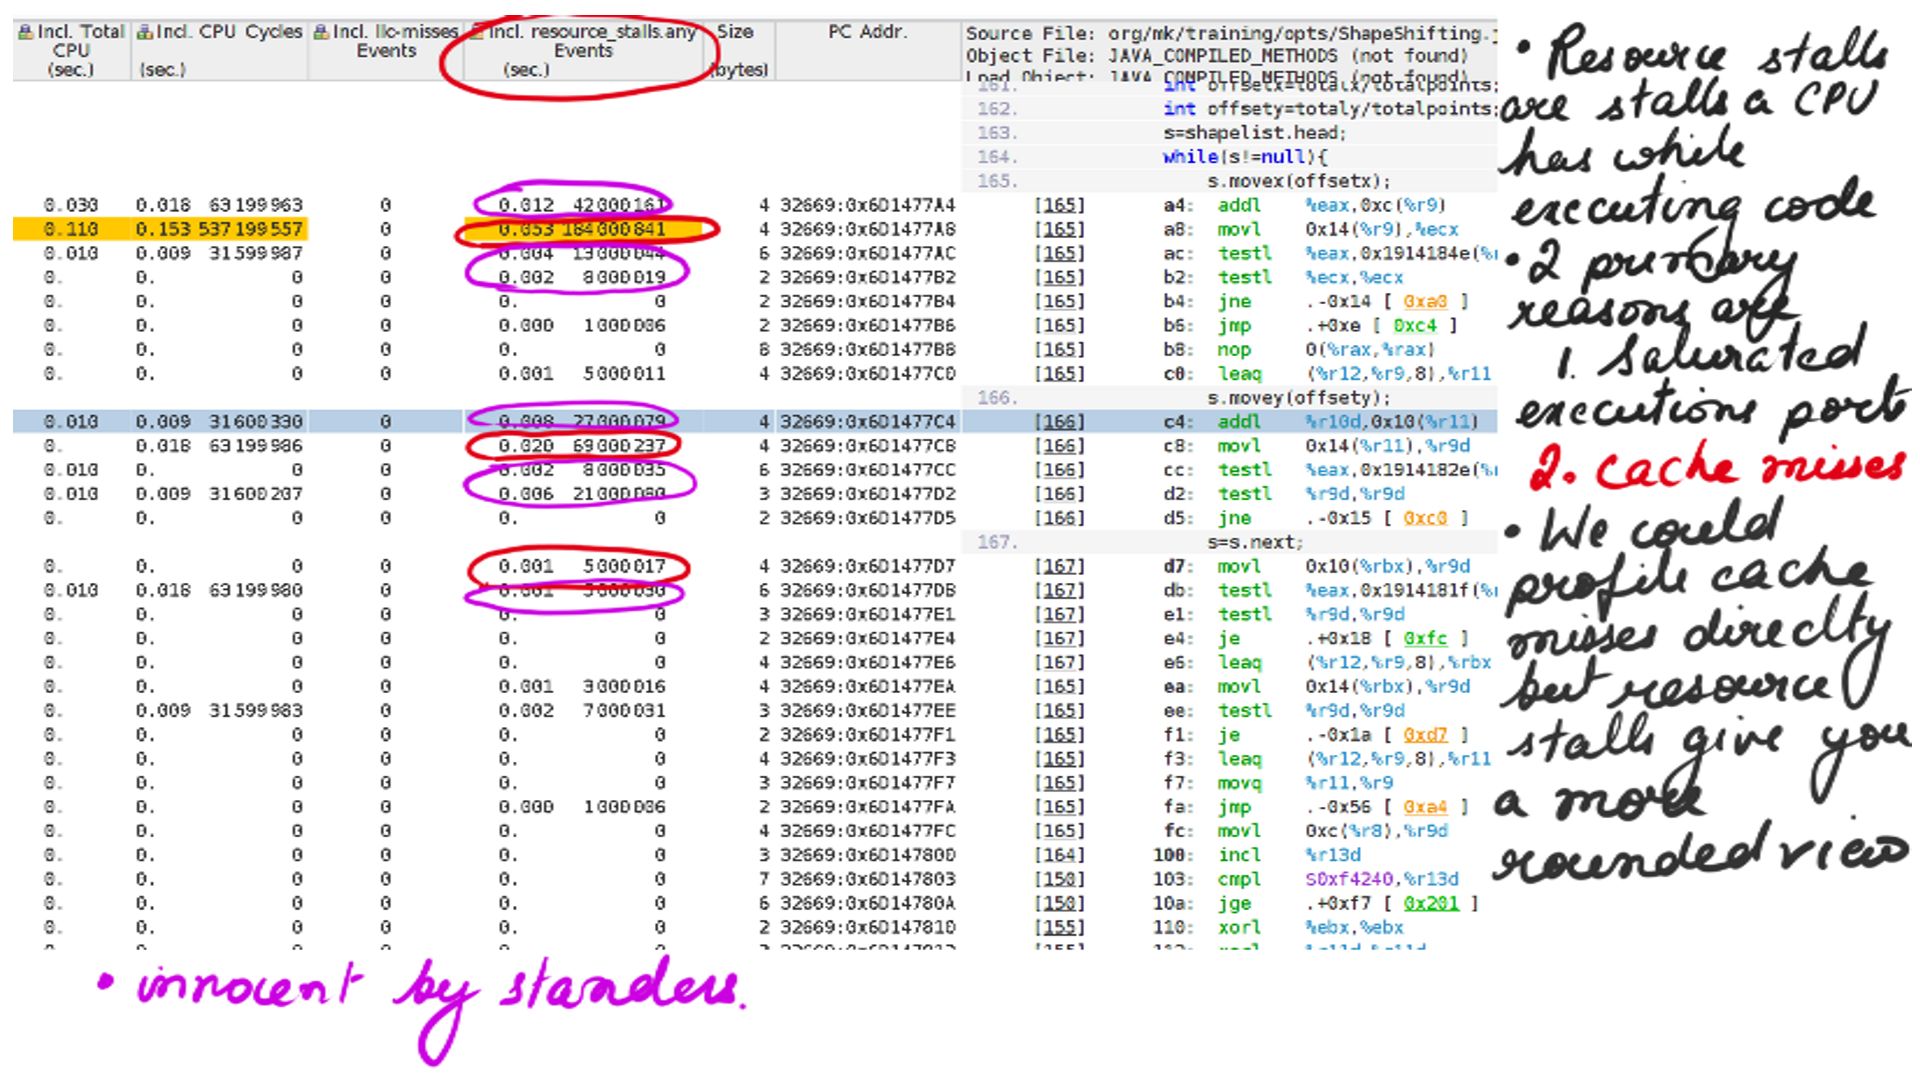
Listing-2Consider the code above, We have a list of points making up a shape and when “movex” or “movey” function gets called with an offset it simply moves all the points’ X or Y coordinates by that offset. Now because it is a list of points that make up the shape, moving through that list going to be expensive because the CPU prefetchers cannot “guess” the pattern of load and cannot preload to cache. This results in resource stalls, which is another way of saying that the CPU is sitting idle.
1
2
3
4
5
6
7
8
9
10
11
12
13
14
15
16
17
18
19
20
21
22
23
24
  public static void main(String [] args){
    long start=System.nanoTime();
    for (int i = 0; i < 1000000; i++) {
        int totalx=0;
        int totaly=0;
        int totalpoints=0;
        Shape s=shapelist.head;
        while(s!=null){
            totalx += s.xsum();
            totaly += s.ysum();
            totalpoints += s.numpoints();
            s=s.next;
        }
        int offsetx=totalx/totalpoints;
        int offsety=totaly/totalpoints;
        s=shapelist.head;
        while(s!=null){
            s.movex(offsetx);
            s.movey(offsety);
            s=s.next;
        }
    }
  }
Listing-3
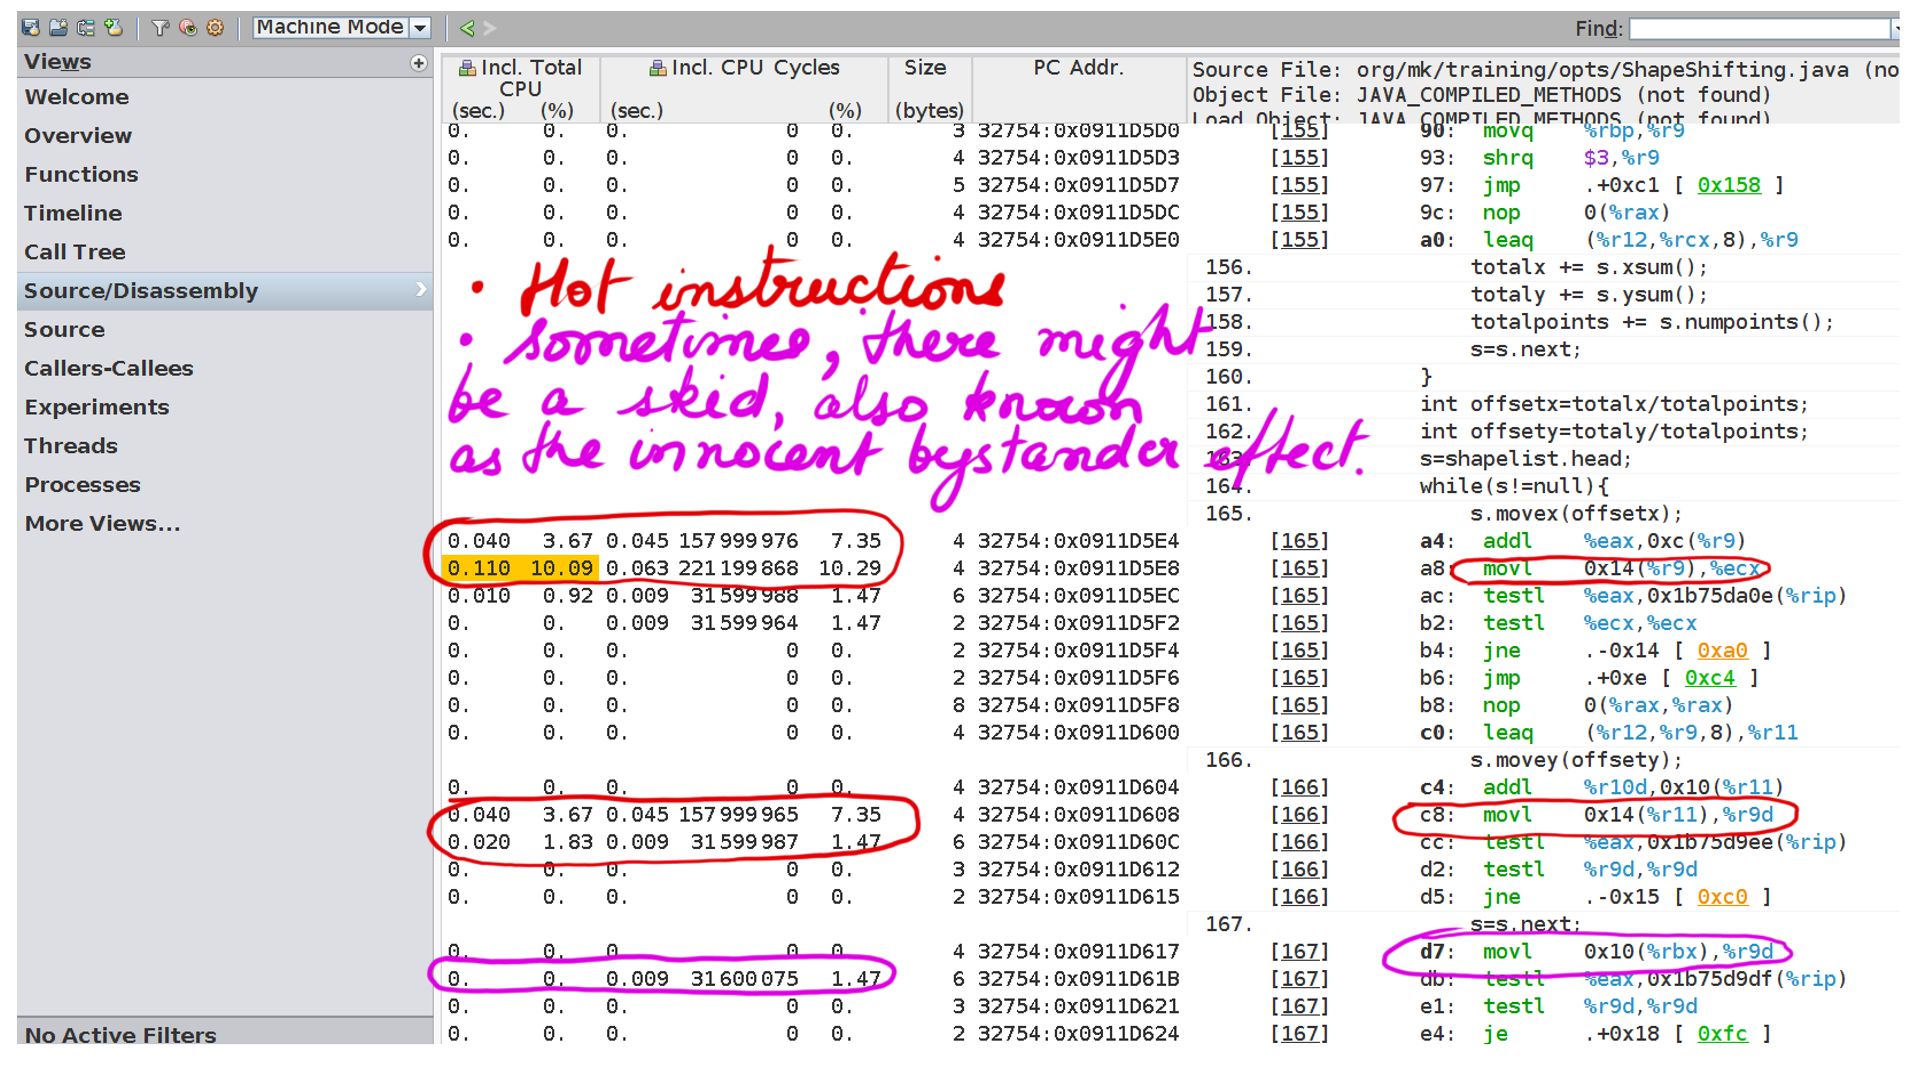
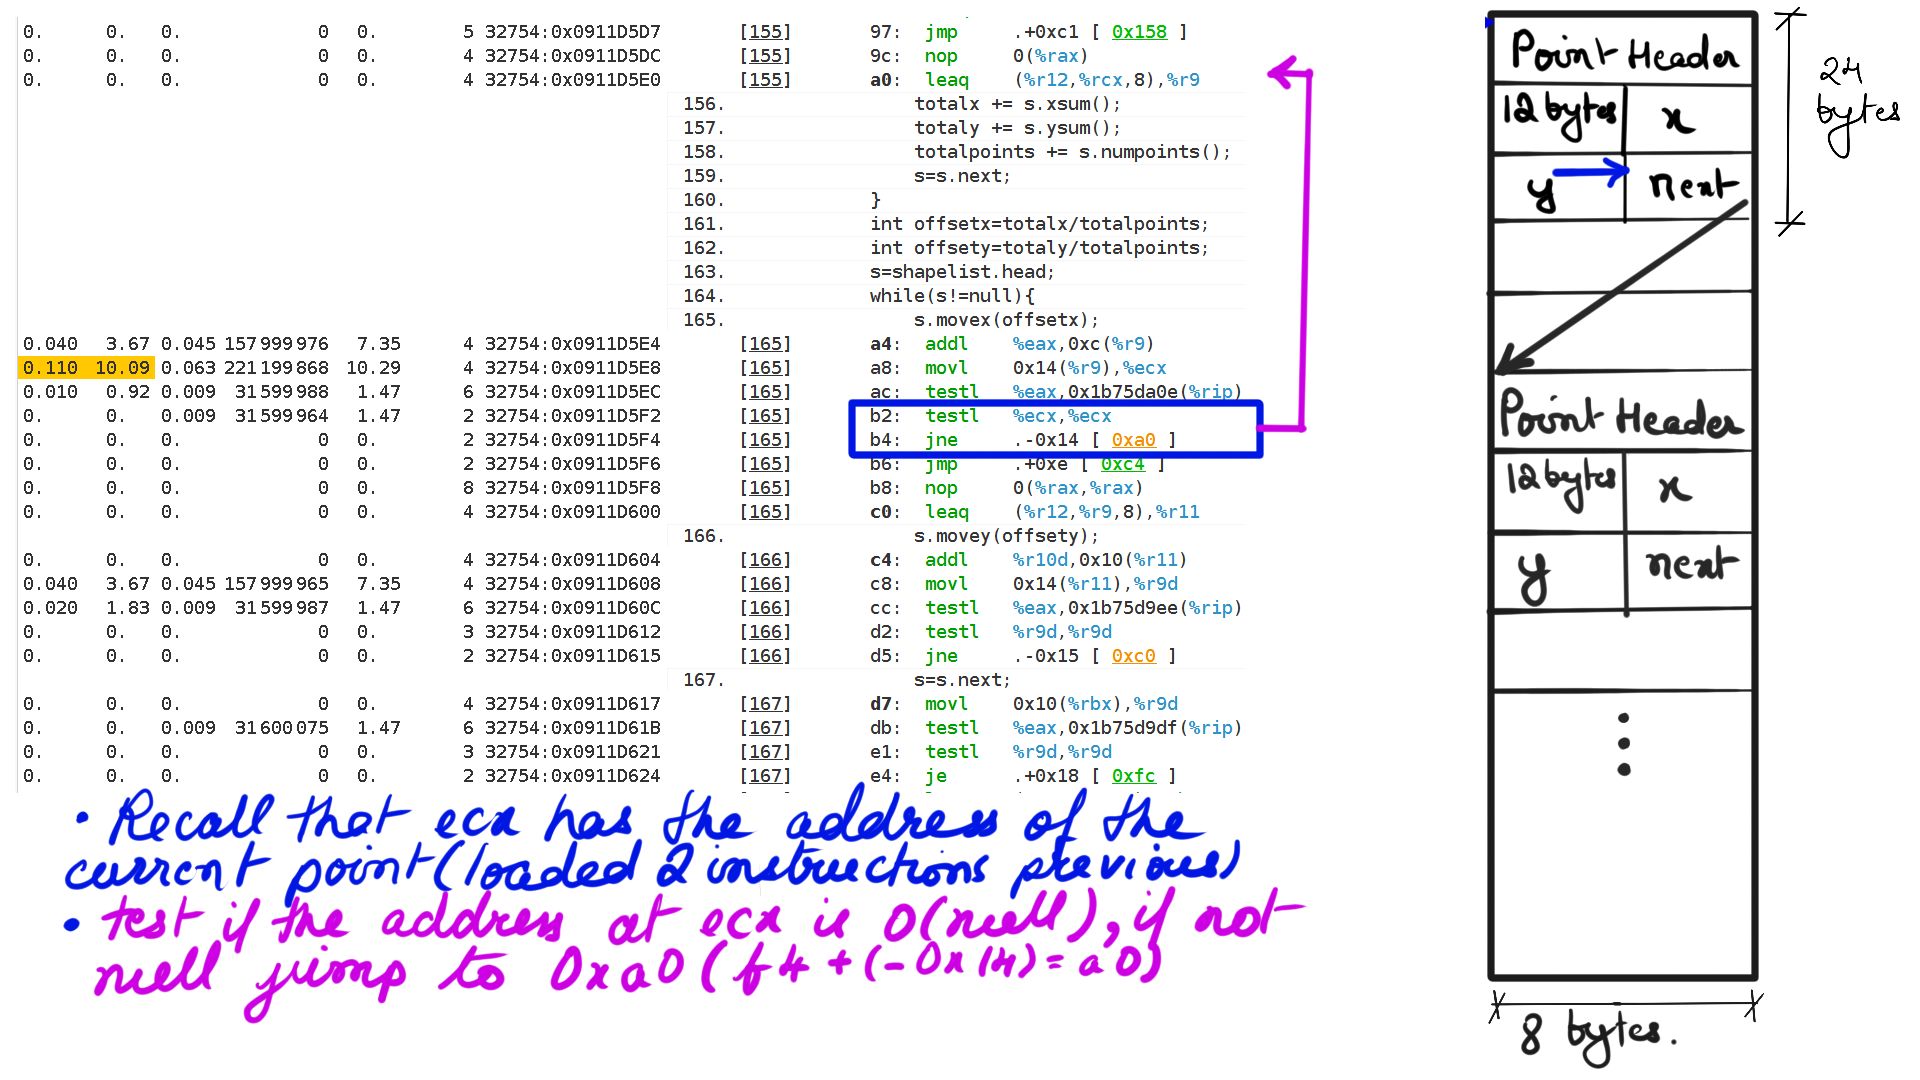
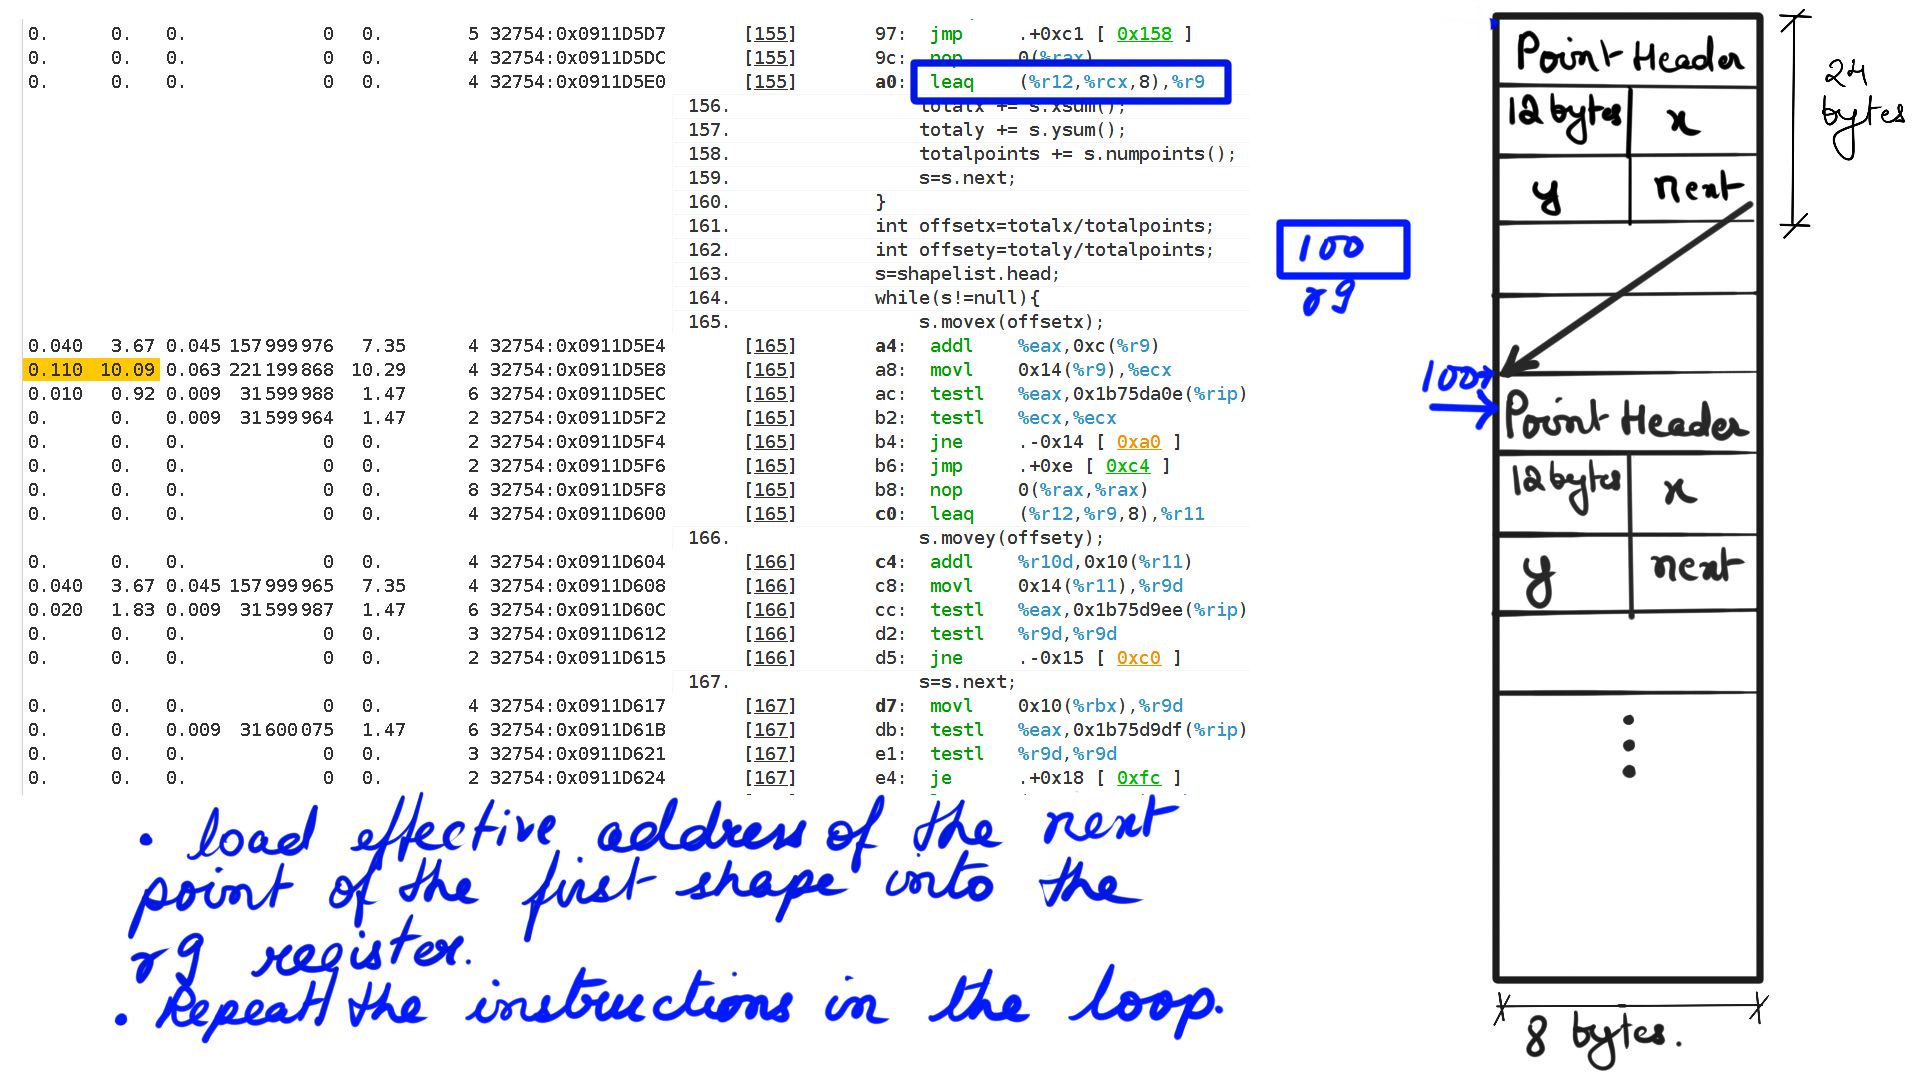
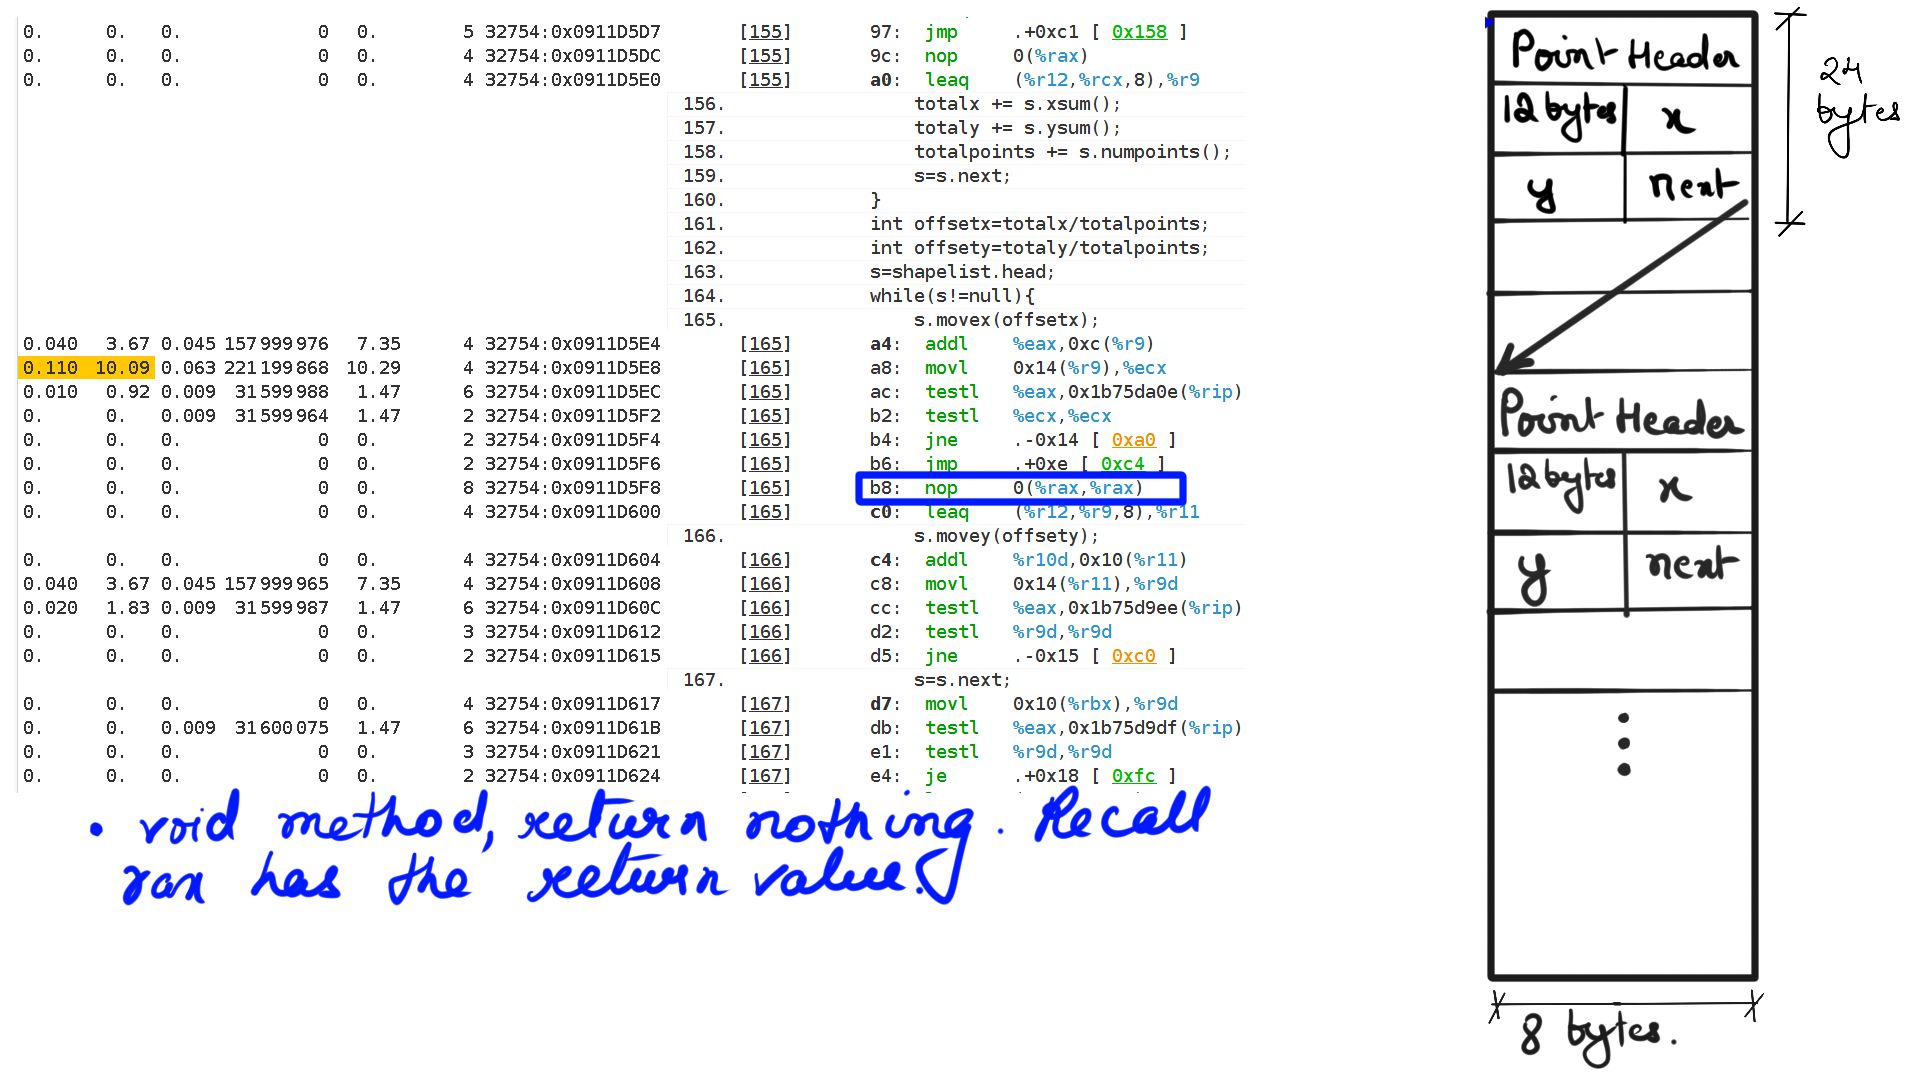
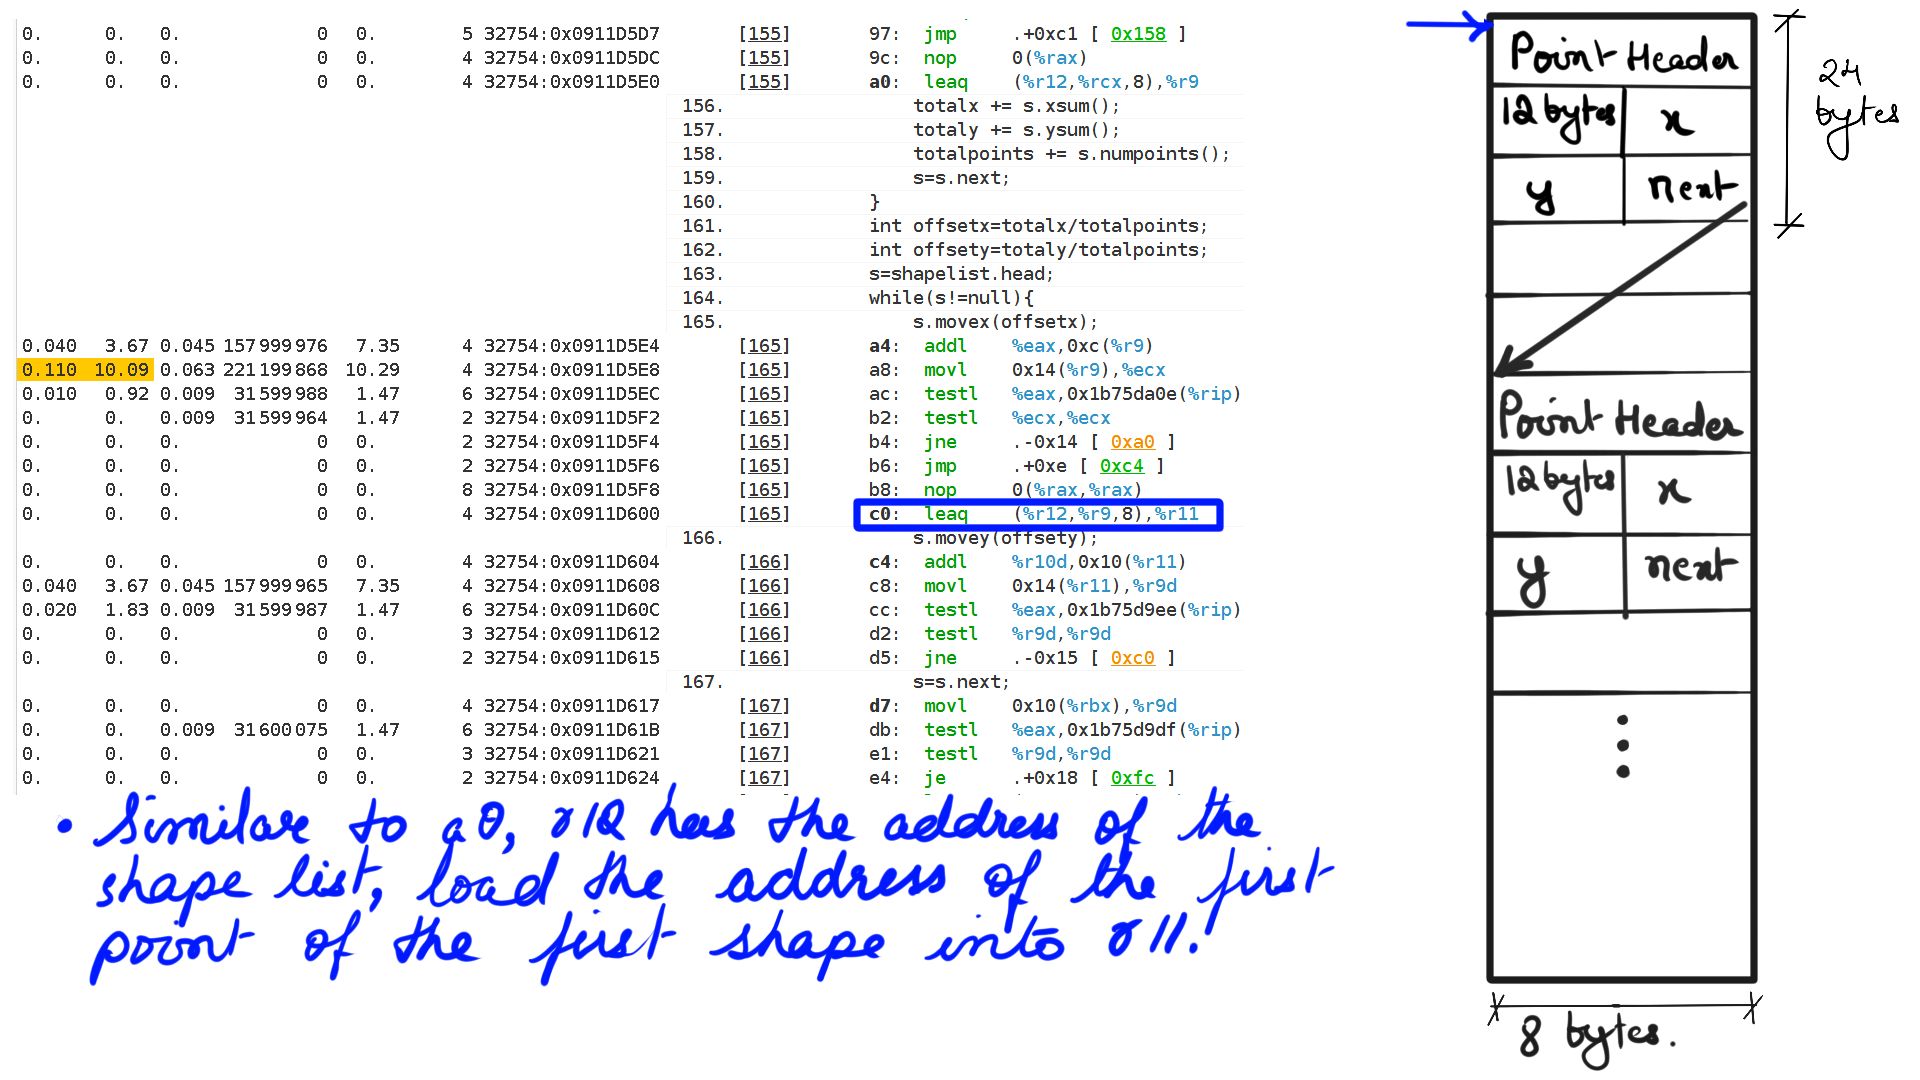
Line 16-21 is where the call is being made to functions “movex” and “movey”. The question is can a profiler pinpoint how the java code executes and the resource stalls that this code is going to encounter. Once this is understood, a similar analogy can be extended to more complex code. Just before we get started a few things to keep in mind.
- The profiler being used is Performance Analyzer also called Solaris Analyzer. Probably one of the best profilers to deep dive into the code at an instruction level. Performance Analyzers would require a post in itself.
- The performance analyzer for this run has be configured to capture resource stalls for the above code.
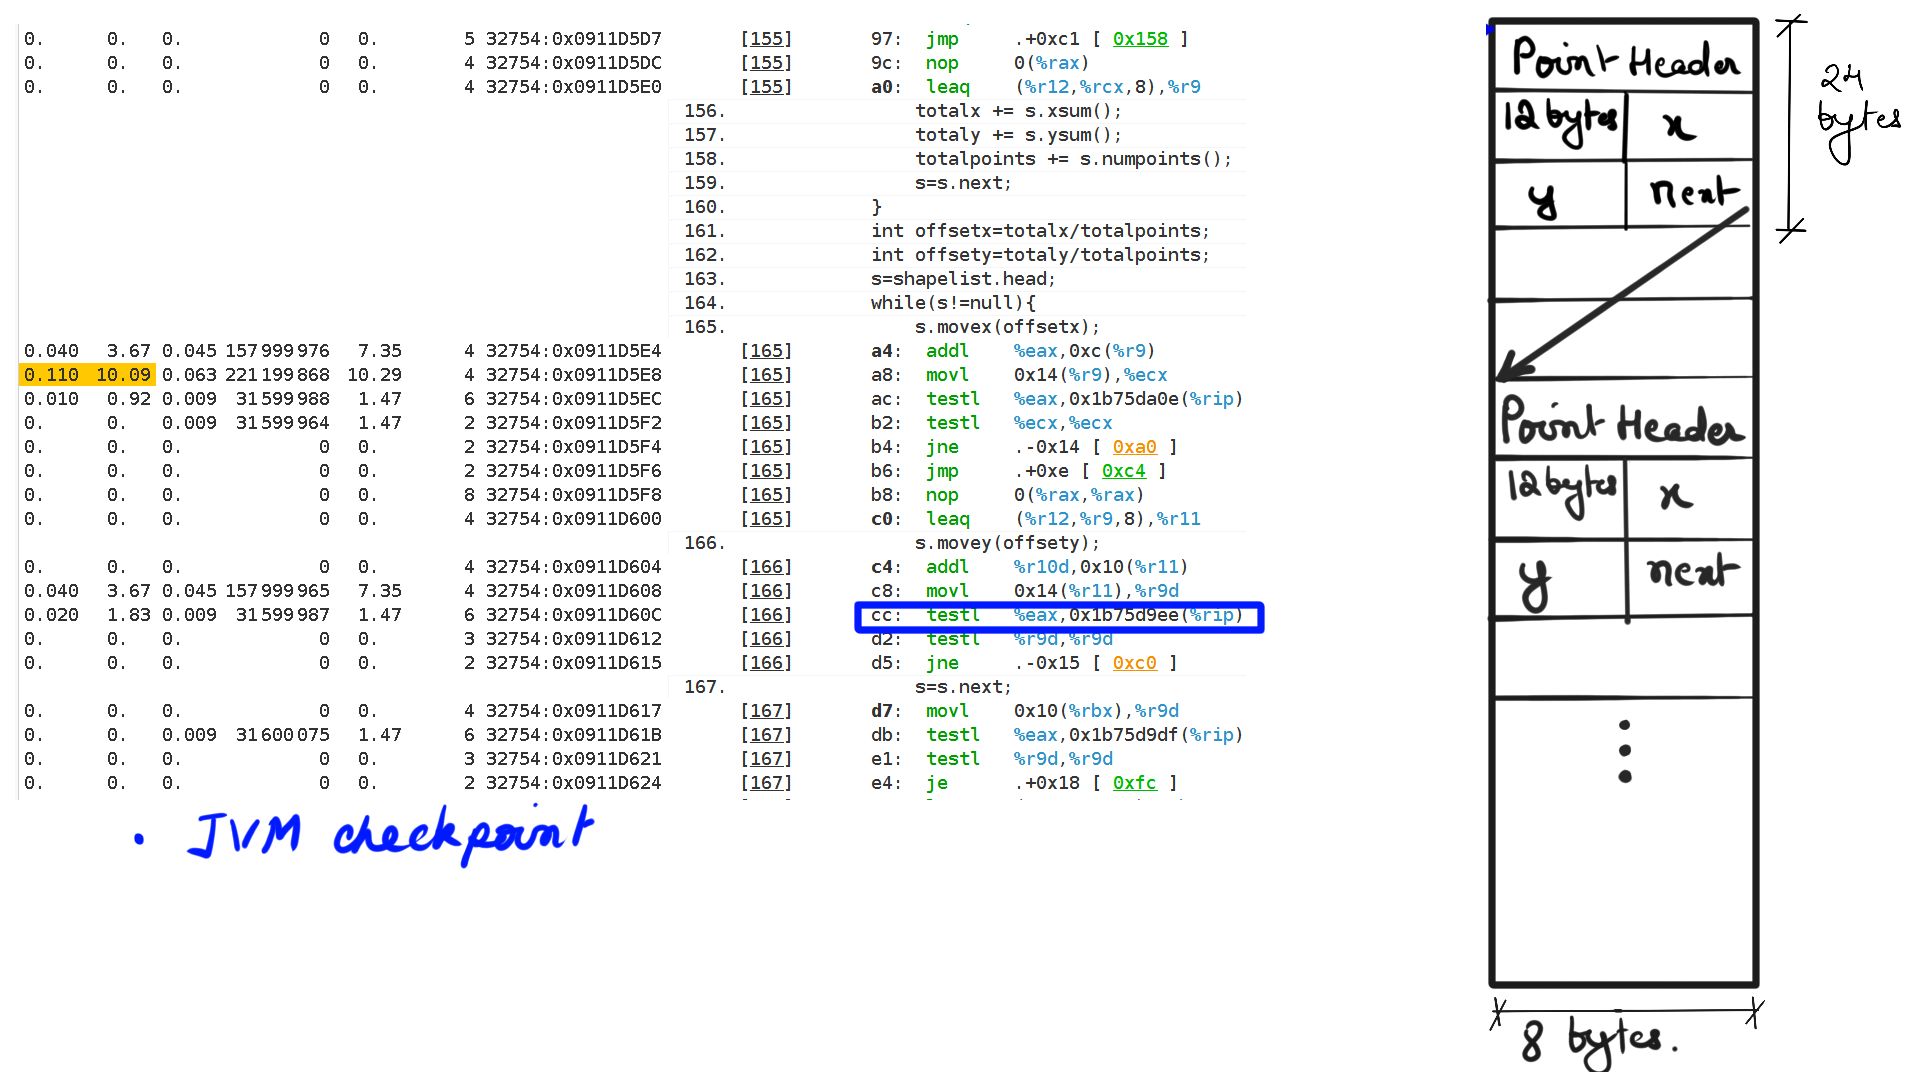
- Despite Java being an interpreted language, in practice, it is optimized on-the-fly by a JIT compiler. These are usually profile guided optimizations and topic for another day. The code shown by Performance Analyzers is JIT compiler generated. Typically we get this profile when the code has run for some time for it to be JIT-compiled.
Code walk through using Solaris Analyzer
- Measuring CPU cycles for the code
- Walk through:Step-1
- Walk through:Step-2
- Walk through:Step-3
- Walk through:Step-4
- Walk through:Step-5
- Walk through:Step-6
- Walk through:Step-7
- Walk through:Step-8
- Walk through:Step-9
- Walk through:Step-10
- Walk through:Step-11
- Walk through:Step-12
- Walk through:Step-13
- Walk through:Step-14
Summary
In summary, then, the figure-17 should clarify the resource stalls exhibited by the code. It is time-consuming to take the first-principles approach to understand deep technical concepts but ultimately it brings great joy. I would like to bring similar understanding to concepts in general and Deep Learning Concepts in particular. In fact, I have seen Neural Machine Translation Based systems grossly underperform and, it was simply because most of the hyperparameters were not understood at all. Deep-Breathe is a complete and pure python implementation of these models, especially but not limited to Neural Machine Translator. In the next few articles, I will go into the details of their inner workings. And in this blog, I will focus more on Pictures and Code.